이중 이동 평균-RSI 모멘텀 추세 추종 전략

1
Follow
1781
Followers
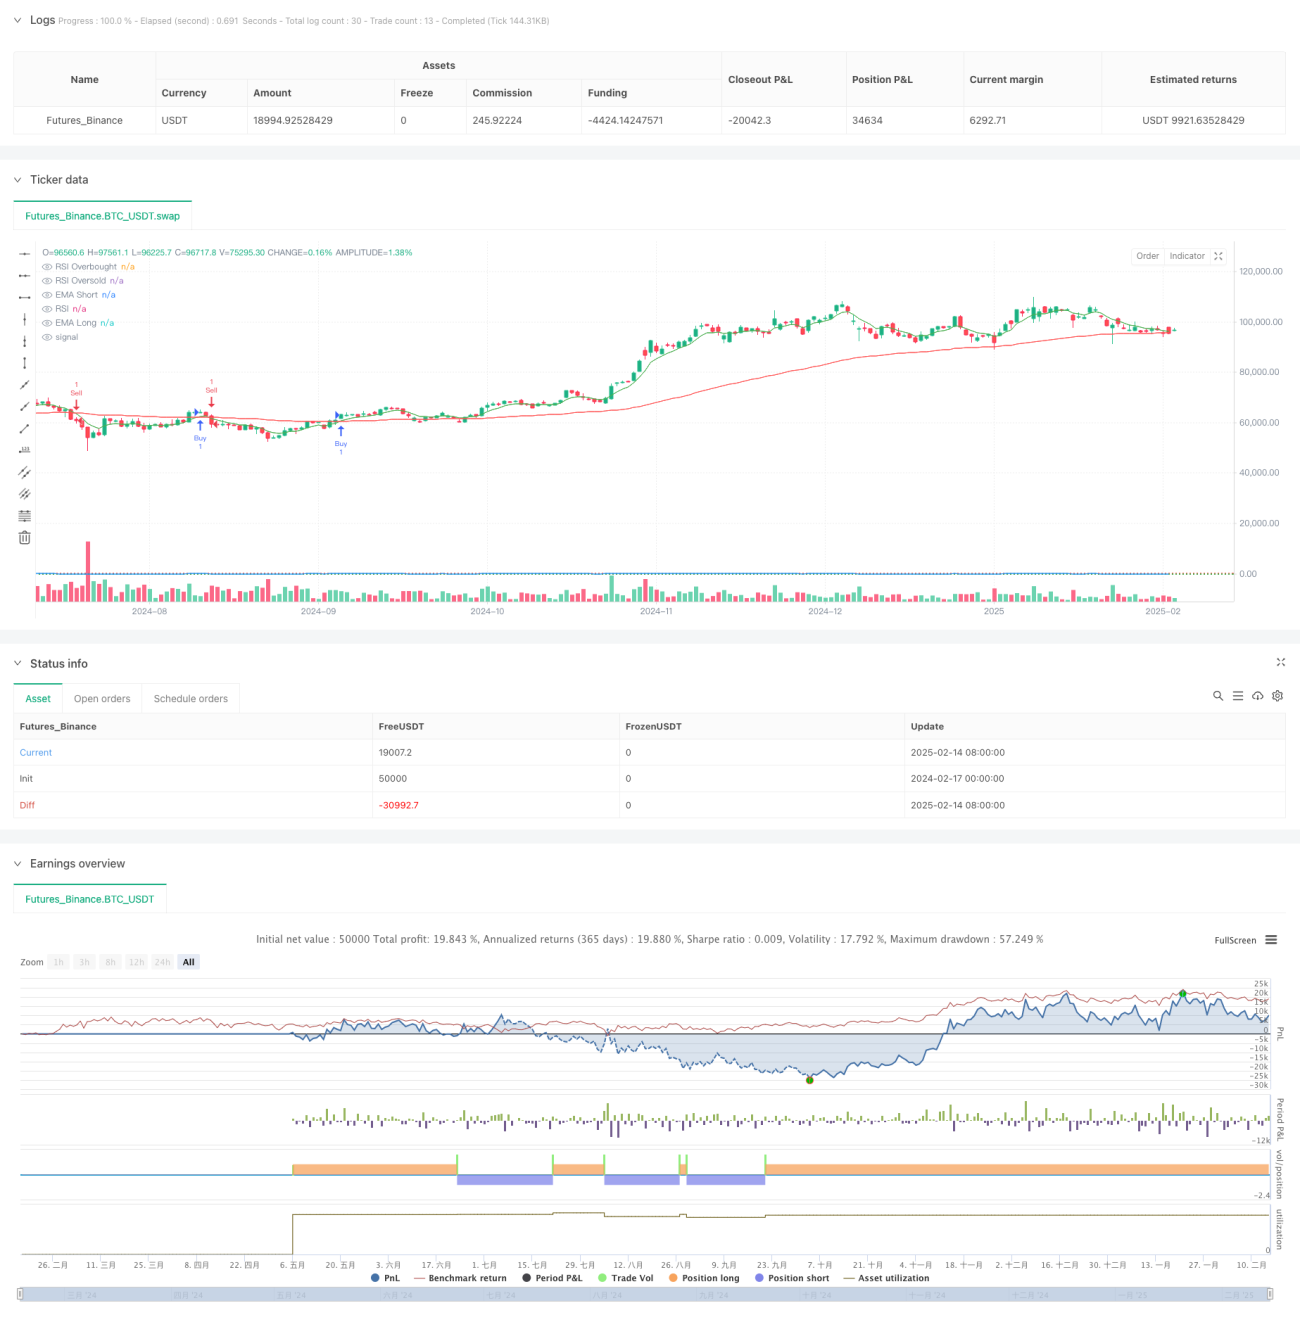
개요
이 전략은 양평선 시스템과 RSI 지표에 기반한 트렌드 추적 거래 시스템이다. 이 전략은 평평선 교차 신호, RSI 초매상 판단 및 가격 돌파 확인을 결합하여 다중 필터링 된 거래 의사 결정 프레임워크를 구축한다. 전략은 6주기 및 82주기 지수 이동 평균 (EMA) 을 통해 중단기 트렌드를 포착하고, 상대적으로 강한 지수 (RSI) 를 사용하여 시장의 과열과 과냉을 필터링하고, 마지막으로 가격 돌파를 통해 거래 신호를 확인한다.
전략 원칙
전략의 핵심 논리는 세 차원의 신호 필터링을 포함합니다:
- 트렌드 판단: 빠른 EMA ((6주기) 와 느린 EMA ((82주기) 의 교차를 사용하여 트렌드 방향을 판단한다. 빠른 선에서 느린 선을 통과하면 다중 신호가 발생하고 빠른 선에서 느린 선을 통과하면 공백 신호가 발생한다.
- 동력 필터링: 14주기 RSI 지표를 사용하여 과도하게 추격하는 추락을 필터링하는 경우. RSI가 70보다 크면 시장이 너무 뜨거워서 과잉을 억제합니다. RSI가 22보다 작으면 시장이 너무 차갑고 공백을 억제합니다.
- 가격확인: 입시시 가격확인이 있어야 한다. 더하는 것은 종결가격 혁신을 높이고, 공백하는 것은 종결가격 혁신을 낮게 한다.
전략적 이점
- 다중 신호 필터링: 기술 지표와 가격 행동을 결합하여 엄격한 신호 필터링 메커니즘을 구축하여 가짜 신호를 효과적으로 감소시킬 수 있다.
- 트렌드 추적과 동력이 결합되어 지속적인 트렌드를 포착할 수 있고, 추락을 억제하는 과도한 추격을 피할 수 있습니다.
- 매개 변수 조정성: 전략의 핵심 매개 변수 (평균선 주기, RSI 마이너스 등) 은 다른 시장 특성에 따라 최적화 될 수 있다.
- 리스크 제어: RSI 과잉 구매 과잉 판매 판단을 통해 리스크 제어 메커니즘이 내장되어 있다.
전략적 위험
- 흔들림 시장의 위험: 가로판 흔들림 시장에서, 평행선 교차 신호가 자주 발생할 수 있으며, 이는 과도한 거래로 이어진다.
- 지연 위험: EMA와 RSI는 지연성이 있으며 시장이 급격하게 변할 때 반응하지 않을 수 있습니다.
- 매개 변수 민감성: 전략 효과는 매개 변수 선택에 민감하며, 다른 시장 환경에는 다른 매개 변수 조합이 필요할 수 있다.
- 신호 희소성: 여러 필터링 메커니즘으로 인해 효과적인 신호가 적어 전략의 수익 기회에 영향을 미칠 수 있다.
전략 최적화 방향
- 동적 파라미터 조정: 시장의 변동에 따라 동적으로 평균선 주기 및 RSI 소수점을 조정하는 적응 메커니즘을 도입 할 수 있습니다.
- 스톱 메커니즘 도입: 이동 스톱 또는 고정 스톱 규칙을 추가하고 위험 제어 능력을 향상시킵니다.
- 시장환경 분류: 시장환경 판단 모듈을 추가하고, 다른 시장 상태에서 다른 파라미터 조합을 사용한다.
- 신호 강도 등급: 신호 조건 충족 정도에 따라 등급 시스템을 설계할 수 있으며, 보유 규모를 조정하기 위해 사용된다.
요약하다
이 전략은 평형 시스템과 RSI 지표의 교묘한 결합을 통해 논리적으로 엄격한 트렌드 추적 시스템을 구축합니다. 전략의 여러 필터링 메커니즘은 위험을 효과적으로 제어하지만 일부 거래 기회를 놓칠 수도 있습니다. 전략은 지속적인 최적화 및 개선으로 다양한 시장 환경에서 안정적인 성능을 유지할 수 있습니다.
Source
Pine
Strategy parameters
Related strategies
Comment
All comments (0)
No data
- 1