트렌드 모멘텀 전략 - 지그재그 다중 기간 동적 밴드 타이밍 시스템

1
Follow
1781
Followers
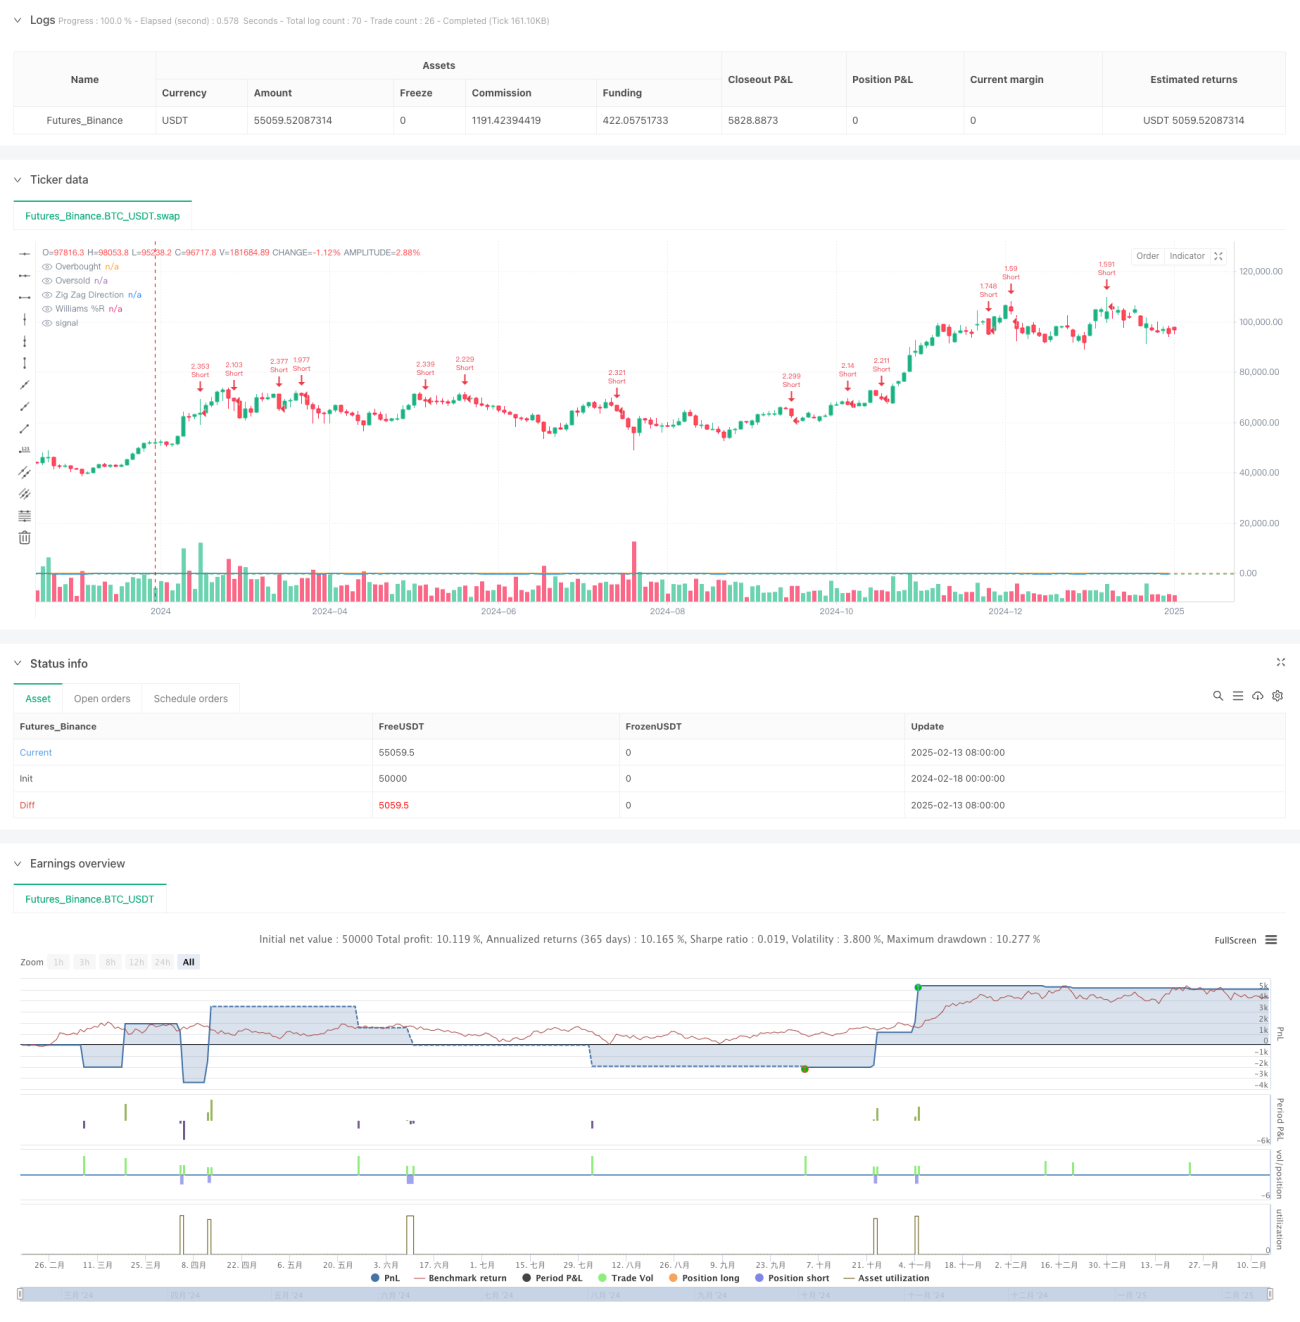
개요
이 전략은 기호 (ZigZag) 지표와 윌리엄 지표 (%R) 를 결합한 다차원 거래 시스템이다. 기호 (ZigZag) 지표를 통해 중요한 파동의 고점과 낮은 지점을 식별하고, 시장이 과매 또는 과매 상태에 도달했을 때 윌리엄 지표를 사용하여 입점을 확인한다. 이러한 조합은 시장의 주요 트렌드 전환점을 포착할 수 있을 뿐만 아니라, 동력을 확인함으로써 거래의 정확성을 향상시킬 수 있다.
전략 원칙
전략의 핵심 논리는 두 가지 주요 구성 요소에 기반합니다.
- 단어형 지표는 설정된 깊이와 오차 파라미터를 통해 눈에 띄는 파장의 높고 낮은 점을 식별하고, 시장 소음을 필터링하여 트렌드 방향을 결정한다. 새로운 파장의 낮은 점이 형성되면 상승 추세가 시작되고, 새로운 파장의 높이는 하락 추세가 시작되는 것을 나타냅니다.
- 윌리엄 지표는 현재 가격을 특정 기간의 최고 가격과 비교하여 시장의 동적 상태를 계산합니다. 지표 값이 80을 돌파하면 과매매를 나타냅니다 (잠재적인 구매 기회), 20을 돌파하면 과매매를 나타냅니다 (잠재적인 판매 기회).
전략의 거래 규칙은 다음과 같습니다.
- 다중 조건: 도자형 지표가 새로운 하위 지점을 식별하고 윌리엄 지표가 초과 판매 영역에서 상향으로 돌파
- 공백 조건: 도그모형 지표가 새로운 파급 고점을 식별하고 윌리엄 지표가 초고 구매 지역에서 아래로 돌파
- 스톱로스는 1%이고, 스톱<unk>은 2%입니다.
전략적 이점
- 다차원 확인: 트렌드 및 동력 이중 확인을 통해 거래 신호의 신뢰성을 향상
- 자기 적응성: 단자형 지표의 편차 파라미터는 시장의 변동률에 따라 동적으로 조정할 수 있다
- 리스크 관리가 완벽하다: 고정된 비율의 스톱 스톱 전략을 사용하여 거래 당 위험을 제어한다.
- 시각화 효과: 태그와 그래픽을 통해 거래 신호를 명확하게 보여주고 분석 및 최적화를 용이하게 합니다.
전략적 위험
- 위기 시장 위험: 수평 시장에서 빈번한 가짜 브레이크 신호가 발생할 수 있습니다.
- 미끄러지 위험: 빠른 시점에 큰 미끄러짐이 발생할 수 있다.
- 매개 변수 민감성: 지표 매개 변수의 선택이 전략 성능에 큰 영향을 미칩니다.
- 신호 지연성: 새로운 진영 지점의 형성을 확인해야 하므로, 몇 가지 빠른 행렬을 놓칠 수 있습니다.
전략 최적화 방향
- 시장 환경 필터를 추가: 시장 상태를 식별하기 위해 변동률 지표를 추가할 수 있으며, 다른 환경에서 다른 파라미터 설정을 사용합니다.
- 동적 중지 손실 최적화: ATR 또는 변동률에 따라 동적으로 중지 손실 위치를 조정할 수 있습니다.
- 거래량 확인을 도입: 신호 생성 시 거래량 검증을 추가
- 시간 필터: 거래 기간 필터를 추가하여 큰 변동이있는 시간에 거래하는 것을 피할 수 있습니다.
요약하다
이것은 트렌드 추적과 동적 거래를 결합한 완전한 거래 시스템이다. 다수의 기술 지표의 연동으로 높은 승률을 유지하면서 위험을 효과적으로 제어 할 수 있다. 약간의 지연이 있지만, 합리적인 파라미터 최적화 및 위험 관리를 통해 안정적인 거래 효과를 달성 할 수 있다. 이 전략은 중장기 추세 상황에 특히 적합하며, 시장에서 명백한 방향성 기회가있을 때 더 잘 수행한다.
Source
Pine
/*backtest
start: 2024-02-18 00:00:00
end: 2025-02-15 08:00:00
period: 2d
basePeriod: 2d
exchanges: [{"eid":"Futures_Binance","currency":"BTC_USDT"}]
*/

//@version=6
strategy("Zig Zag + Williams %R Strategy", overlay=true, default_qty_type=strategy.percent_of_equity, default_qty_value=300)

// ====================Strategy parameters
Related strategies
Comment
All comments (0)
No data
- 1