
1
Follow
1781
Followers
개요
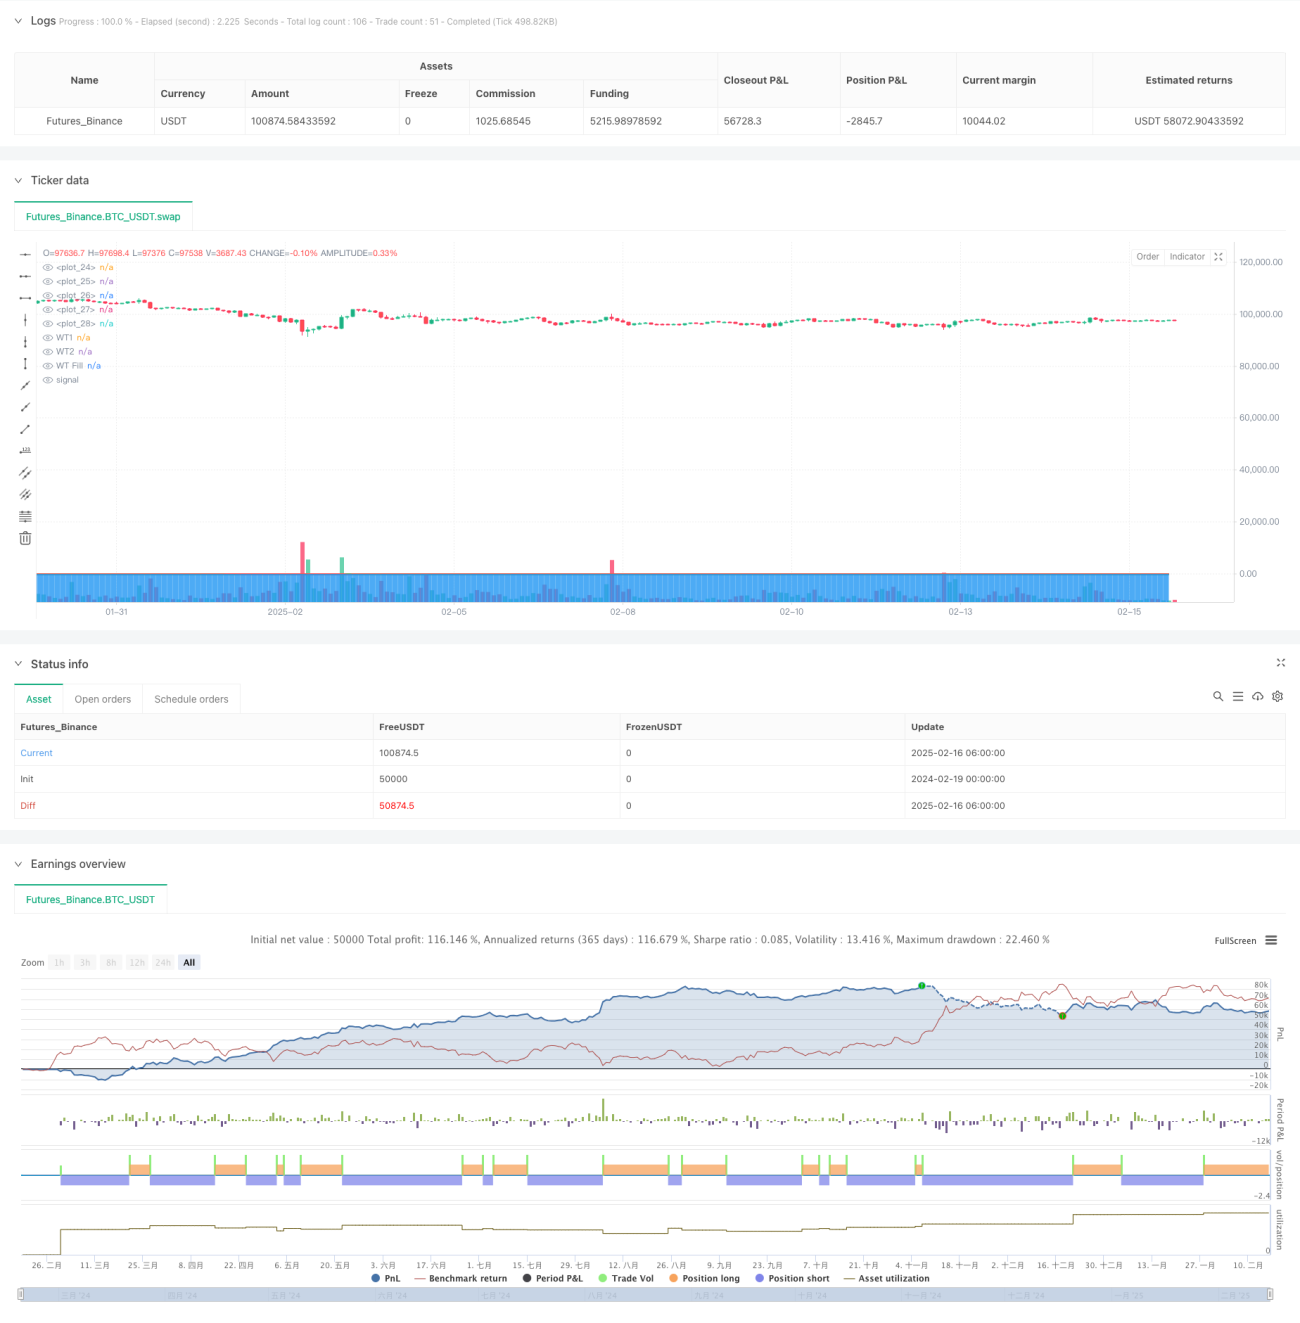
이 전략은 파동 트렌드 지표 (WaveTrend) 를 기반으로 한 동적 거래 시스템으로, 가격의 동적 변화를 계산하여 시장의 과매매 상태를 식별하고, 중요한 가격 수준이 돌파될 때 거래 신호를 발생시킵니다. 이 전략은 쌍방향 처리 된 동적 곡선을 (WT1 및 WT2) 사용하여 시장 소음을 필터링하여 신호의 신뢰성을 향상시킵니다.
전략 원칙
전략의 핵심은 다음과 같은 단계를 통해 파동 트렌드 지표를 구축하는 것입니다.
- HLC3 가격을 기준으로, n1주기의 지수 이동 평균 ((EMA) 을 가격 중심으로 계산한다
- 가격의 중심으로부터의 편차를 계산하고 0.015을 표준화 인자로 사용합니다.
- 오차에 대한 n2주기의 EMA 평준화는 주요 트렌드 라인 WT1을 얻습니다.
- WT1에 대한 4주기 간단한 이동 평균 (SMA) 을 매끄럽게 하여 신호 라인 WT2를 얻는다.
- 거래 트리거를 오버 바이 (60) 및 오버 셀 (60) 레벨에서 설정합니다.
WT1이 과매도 영역에서 WT2을 상향으로 통과할 때, 더 많은 신호를 생성한다. WT1이 과매도 영역에서 WT2을 하향으로 통과할 때, 빈 신호를 생성한다.
전략적 이점
- 신호 생성 메커니즘은 안정적이며, 오버 바이 오버 셀 필터와 더블 플레싱을 통해 가짜 신호를 현저하게 감소시킵니다.
- 매개 변수는 조정 가능하며, 거래자는 채널 길이와 평균 주기를 다른 시장 특성에 따라 조정할 수 있습니다.
- 트렌드 추적과 역동적 역전의 장점을 결합하여 큰 트렌드를 포착하고 극한의 위치에서 역전 거래를 할 수 있습니다.
- 시각화 효과가 뛰어나서 거래자는 시장 상태와 잠재적인 거래 기회를 직관적으로 이해할 수 있습니다.
전략적 위험
- 변동성이 큰 시장에서는 빈번한 거래 신호가 생성되어 거래 비용이 증가할 수 있습니다.
- 고정 매수 과다 및 매도 과다 임계값은 모든 시장 환경에 적합하지 않을 수 있습니다.
- 이중 매끄러운 처리는 신호의 지연을 유발할 수 있으며, 빠른 상태에서 최적의 입구 지점을 놓칠 수 있습니다.
- 위험을 통제하기 위해 합리적인 스톱 로즈 설정이 필요하며, 전략 자체에는 통합된 완전한 위험 관리 장치가 없습니다.
전략 최적화 방향
- 시장 변동에 따라 동적으로 조정되는 적응형 과매매 경계를 도입합니다.
- 거래량 확인 메커니즘을 강화하고 신호의 신뢰도를 높여줍니다.
- 통합 트렌드 강도 필터, 강한 트렌드에서 역거래를 줄여
- 시간 필터를 추가하여 시장의 변동성이 낮은 시간에 거래하는 것을 피하십시오.
- 전체 포지션 관리 시스템을 개발하여 신호 강도에 따라 포지션 규모를 동적으로 조정합니다.
요약하다
이는 합리적인 트렌드 동력 거래 전략을 설계하여 파동 트렌드 지표를 통해 시장의 역전 기회를 효과적으로 포착하는 것이다. 전략의 핵심 장점은 안정적인 신호 생성 메커니즘과 좋은 조정성이다. 제안된 최적화 방향을 통해 전략의 안정성과 수익성을 더욱 향상시킬 수 있다. 중·장기 거래 기회를 찾는 투자자들에게는 고려할 만한 거래 시스템이다.
Source
Pine
Strategy parameters
Comment
All comments (0)
No data
- 1