
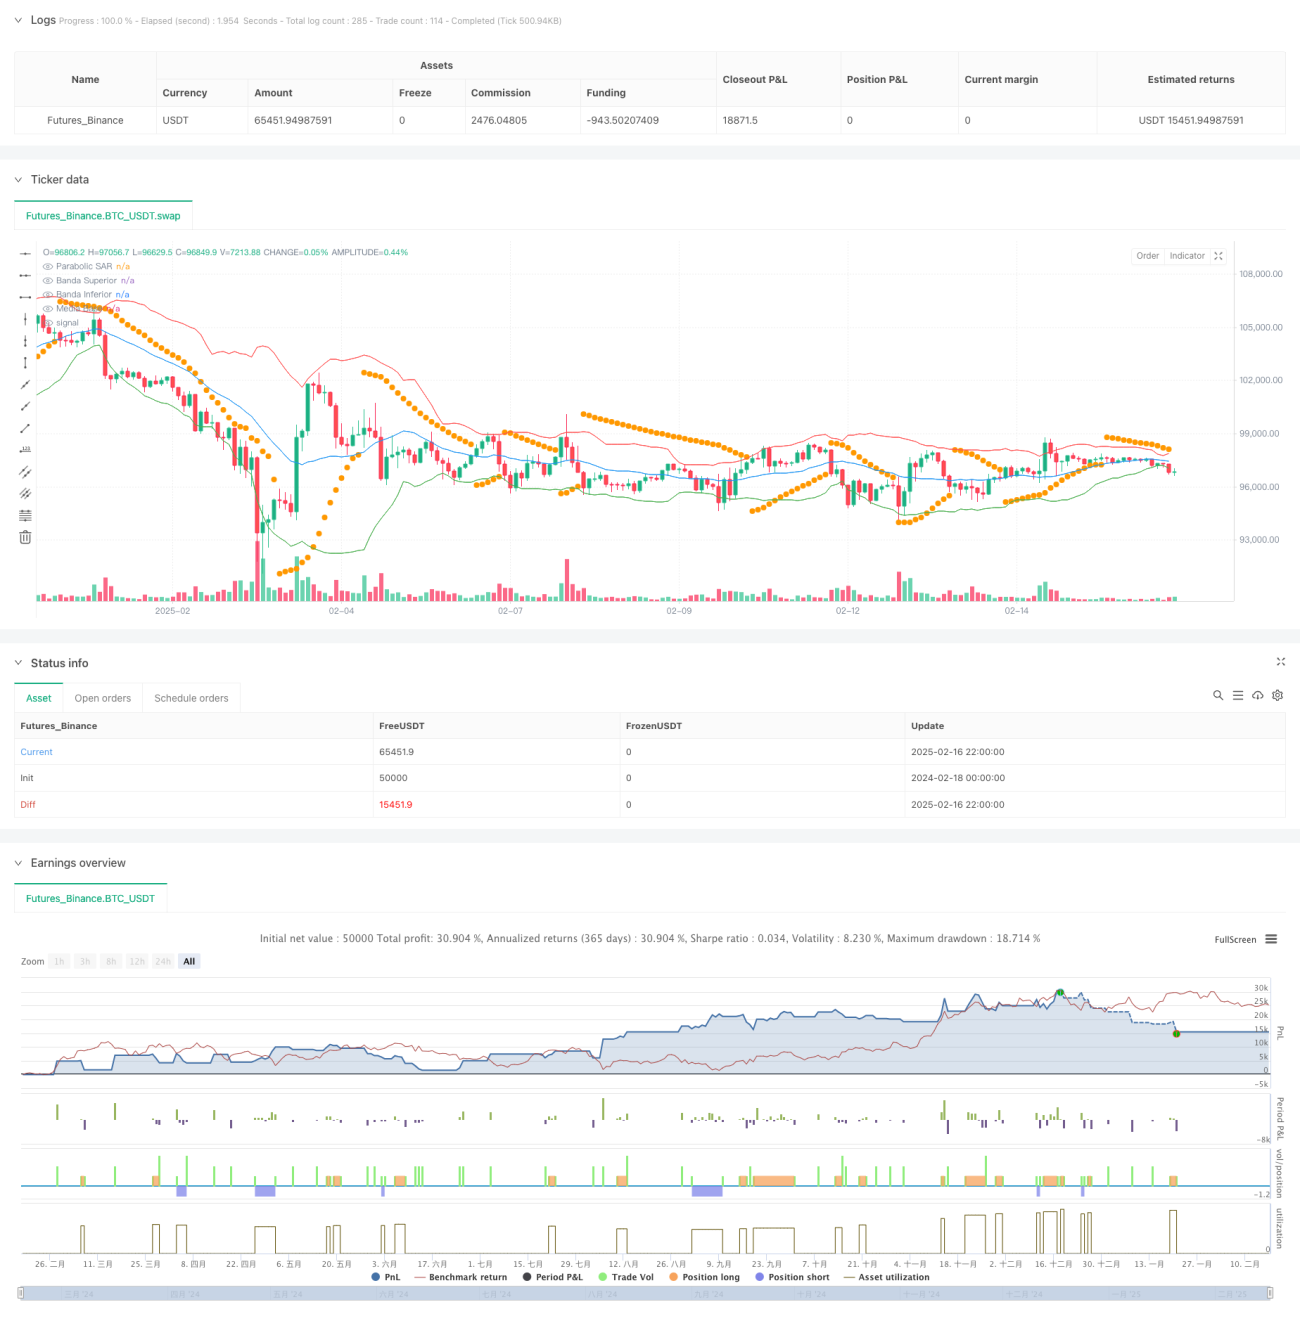
이것은 부린띠와 패러블라인 전환 지표 ((PSAR) 를 결합한 통합 거래 전략이며, 고정된 위험/수익 비율을 사용하여 거래를 관리한다. 이 전략은 주로 일일 거래 시간대에 운영되며, 가격의 부린띠 및 그래프 형태를 뚫고 거래 기회를 식별하고, 동시에 PSAR 지표를 사용하여 트렌드를 확인한다. 이 전략은 다이내믹 스톱 손실과 수익 목표 설정을 채택하고, 위험/수익 비율을 1:3으로 유지한다.
다중 기술 지표를 사용하여 거래 신호를 확인하는 전략:
이 전략은 브린밴드, PSAR 지표 및 그라프 분석을 통합하여 전체적인 거래 시스템을 구축한다. 이 전략의 핵심 장점은 다중 기술 지표의 연동과 엄격한 위험 관리이다. 일부 고유한 위험이 존재하지만, 제안된 최적화 방향은 전략의 안정성과 수익성을 더욱 향상시킬 수 있다. 이 전략은 특히 일간 거래 사용자에 적합하며 위험을 통제하면서 안정적인 수익을 얻을 수 있다.
/*backtest
start: 2024-02-18 00:00:00
end: 2025-02-17 00:00:00
period: 2h
basePeriod: 2h
exchanges: [{"eid":"Futures_Binance","currency":"BTC_USDT"}]
*/
//@version=6
strategy("Estrategia Bollinger con PSAR y TP Máximo/ Mínimo", overlay=true)
// Parámetros de las Bandas de Bollinger
bb_length = input.int(20, title="Periodo de Bandas de Bollinger", minval=1)
bb_stddev = input.float(2.0, title="Desviación Estándar", step=0.1)
// Parámetros del Parabolic SAR
psar_start = input.float(0.02, title="PSAR Factor Inicial", step=0.01)
psar_increment = input.float(0.02, title="PSAR Incremento", step=0.01)
psar_max = input.float(0.2, title="PSAR Máximo", step=0.01)
// Cálculo de Bandas de Bollinger
basis = ta.sma(close, bb_length)
upper_band = basis + bb_stddev * ta.stdev(close, bb_length)
lower_band = basis - bb_stddev * ta.stdev(close, bb_length)
// Cálculo del Parabolic SAR
psar = ta.sar(psar_start, psar_increment, psar_max)
// Cálculo del cuerpo de la vela
body_high = math.max(open, close)
body_low = math.min(open, close)
body_length = body_high - body_low
total_length = high - low
body_ratio = body_length / total_length
// Condiciones de Entrada
long_condition = close > upper_band and body_ratio >= 0.33
short_condition = close < lower_band and body_ratio >= 0.33
// Filtro de tiempo: Operar solo de 7:30 AM a 4:00 PM hora colombiana
start_time = timestamp("GMT-5", year, month, dayofmonth, 7, 30)
end_time = timestamp("GMT-5", year, month, dayofmonth, 16, 0)
time_condition = (time >= start_time) and (time <= end_time)
// Variables para mantener el TP máximo y mínimo
var float max_tp = na
var float min_tp = na
var float dynamic_stop = na
// Condiciones de Entrada y Salida
if (long_condition and time_condition)
entry_price = close // Precio de entrada
stop_loss = low // SL en el mínimo de la vela
take_profit = entry_price + 3 * (entry_price - stop_loss) // TP con relación 1:3
strategy.entry("Compra", strategy.long)
strategy.exit("Exit Compra", "Compra", stop=stop_loss, limit=take_profit)
// Dibujar las etiquetas para SL y TP para la operación larga
label.new(bar_index, stop_loss, text="SL: " + str.tostring(stop_loss), style=label.style_label_up, color=color.red, textcolor=color.white, size=size.small)
label.new(bar_index, take_profit, text="TP: " + str.tostring(take_profit), style=label.style_label_down, color=color.green, textcolor=color.white, size=size.small)
if (short_condition and time_condition)
entry_price = close // Precio de entrada
stop_loss = high // SL en el máximo de la vela
take_profit = entry_price - 3 * (stop_loss - entry_price) // TP con relación 1:3
strategy.entry("Venta", strategy.short)
strategy.exit("Exit Venta", "Venta", stop=stop_loss, limit=take_profit)
// Dibujar las etiquetas para SL y TP para la operación corta
label.new(bar_index, stop_loss, text="SL: " + str.tostring(stop_loss), style=label.style_label_down, color=color.red, textcolor=color.white, size=size.small)
label.new(bar_index, take_profit, text="TP: " + str.tostring(take_profit), style=label.style_label_up, color=color.green, textcolor=color.white, size=size.small)
// Dibujar Bandas de Bollinger
plot(upper_band, color=color.red, title="Banda Superior")
plot(lower_band, color=color.green, title="Banda Inferior")
plot(basis, color=color.blue, title="Media Base")
// Dibujar Parabolic SAR
plot(psar, style=plot.style_circles, color=color.orange, title="Parabolic SAR")