볼린저 밴드 크로스오버 신호 스크리닝 트레이딩 전략

1
Follow
1789
Followers
개요
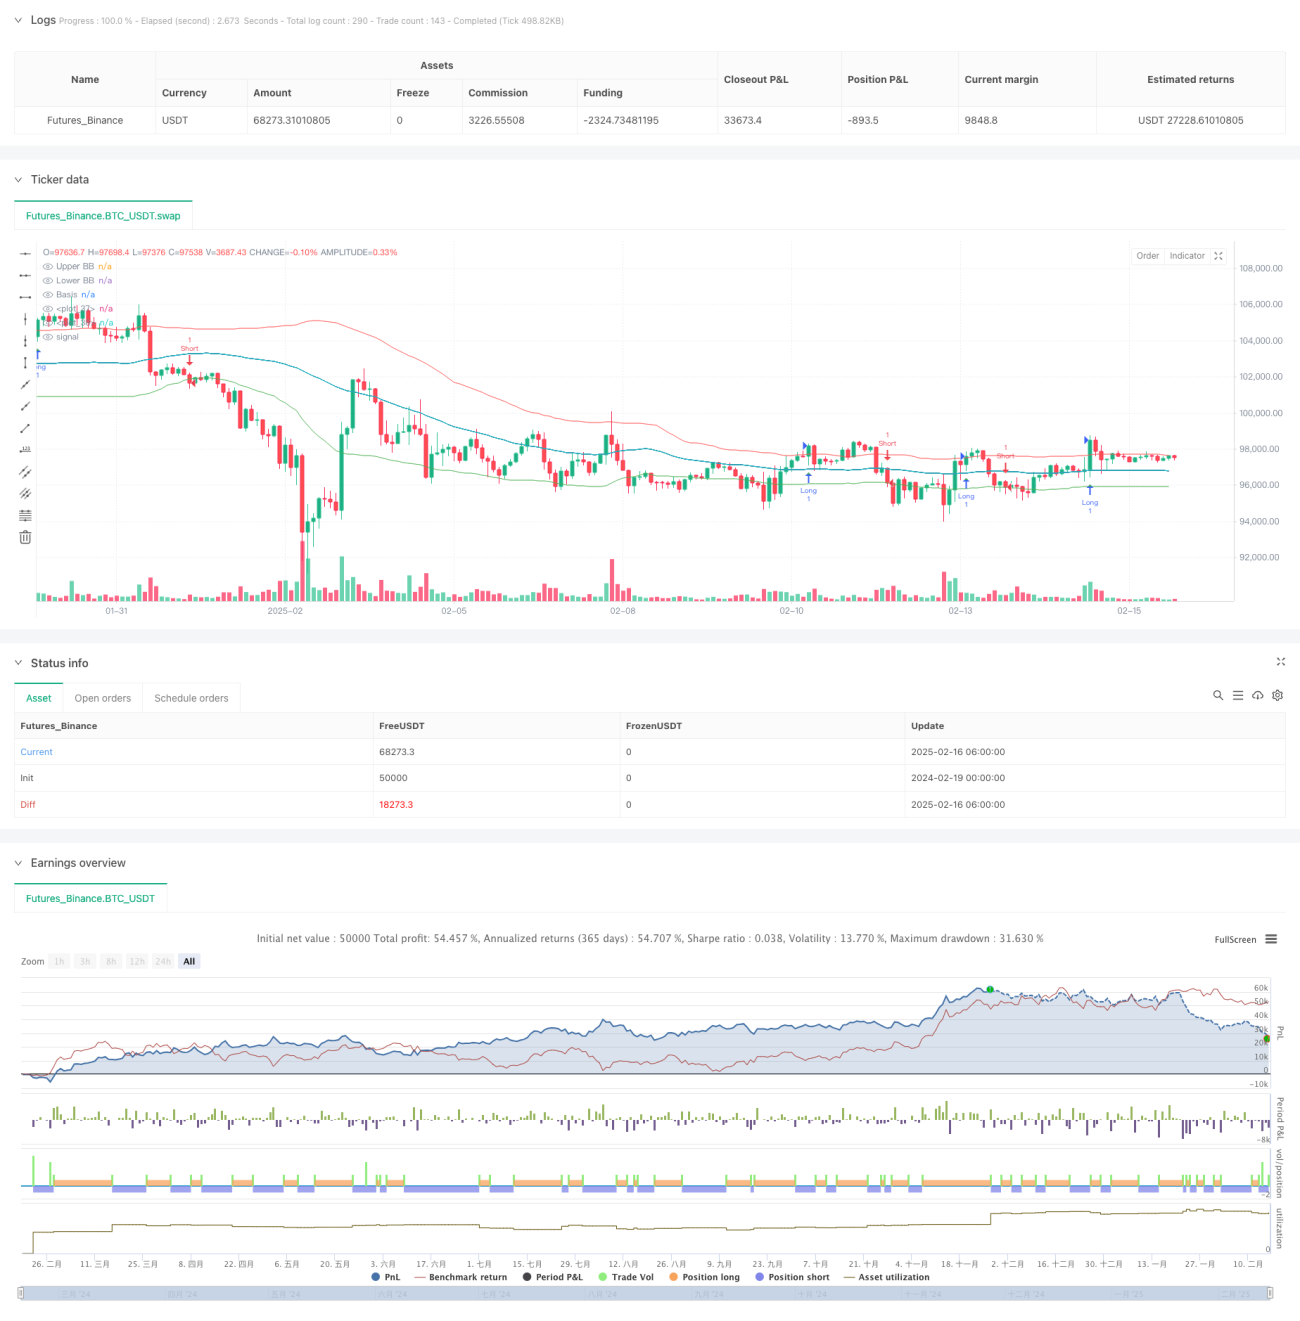
이것은 부린 띠 지표에 기반한 거래 전략으로, 가격과 부린 띠의 교차 관계를 통해 시장의 흐름을 식별하고 거래 신호를 생성한다. 이 전략은 55주기의 이동 평균을 부린 띠의 중간 궤도로 사용하며, 1.0배의 표준 차이는 부린 띠의 상하 궤도로 계산된다. 이 전략의 핵심은 부린 띠의 상하 궤도를 돌파하여 장과 공백 시간을 결정하는 것이다.
전략 원칙
전략의 작동 원리는 다음과 같은 몇 가지 핵심 부분을 포함합니다.
- 브린 밴드 계산: 55주기 간단한 이동 평균 ((SMA) 을 중간 궤도로 사용하고, 표준 차이의 배수는 1.0이며, 궤도 상하로 계산한다.
- 신호 생성 논리:
- 마감 가격이 경로를 돌파 할 때, 다중 신호가 생성됩니다.
- 마감 가격이 하향 궤도를 돌파 할 때 마이너스 신호를 생성합니다.
- 신호 확인 메커니즘: barssince 함수를 사용하여 마지막 돌파구로부터의 사이클 수를 계산하고, 빈 신호의 사이클 거리를 비교하여 최종 거래 방향을 결정한다.
- 시각화 부분: 차트 상의 삼각형 표기법을 통해 거래 신호를 표시하고, 다른 색상을 사용하여 공백을 구분한다.
전략적 이점
- 신호 명확성: 가격과 브린 띠의 명확한 교차 관계를 통해 거래 신호를 생성하여 모호한 지대를 피한다.
- 트렌드 따라: 전략은 본질적으로 트렌드 따라하는 형태이며, 강세를 보이는 상황에서 더 나은 수익을 얻을 수 있다.
- 시각적 직관: 색상 채우기 및 모양 표시를 통해 거래 신호를 식별하는 것은 매우 직관적입니다.
- 매개 변수 유연성: 브린 밴드의 주기 및 표준 차이의 배수는 다른 시장 상황에 따라 조정할 수 있다.
- 시스템 완전함: 완전한 신호 생성, 시각화 및 경보 기능을 포함한다.
전략적 위험
- 흔들림 시장 위험: 가로판 흔들림 시장에서 빈번하게 잘못된 신호가 발생할 수 있다.
- 지연 위험: 더 긴 주기 ((55) 의 이동 평균을 사용했기 때문에 신호가 다소 지연될 수 있다.
- 역전 위험: 트렌드가 급격히 역전될 경우, 더 큰 회수를 감수할 수 있다.
- 매개 변수 민감성: 브린 밴드 매개 변수의 선택은 전략 성능에 큰 영향을 미칩니다.
전략 최적화 방향
- 트랜지먼트 확인 도입: 트랜지먼트 지표가 신호 확인의 보조 조건으로 추가될 수 있다.
- 동적 파라미터 최적화: 시장의 변동률에 따라 동적으로 조정할 수 있는 브린 밴드의 표준 차이의 배수.
- 트렌드 필터를 추가: 가짜 신호를 필터링하기 위해 더 긴 주기 트렌드 지표를 추가할 수 있다.
- 손해제도 개선: 이동형 손해제도 또는 고정형 손해제도를 추가하여 위험을 통제하는 것이 좋습니다.
- 시장 상태 분류: 시장 상태 식별 모듈을 추가하여 다른 시장 상태에서 다른 파라미터 설정을 사용할 수 있습니다.
요약하다
이것은 부린띠에 기반한 고전적인 트렌드 추적 전략으로, 가격과 부린띠의 교차 관계를 통해 시장 트렌드를 포착한다. 전략 설계는 간결하고 명확하며, 좋은 시각화 효과와 신호 생성 메커니즘을 가지고 있다. 흔들리는 시장에서 도전을 받을 수 있지만, 적절한 매개 변수 최적화와 보조 지표를 추가하면 전략의 안정성과 신뢰성을 더욱 향상시킬 수 있다.
Source
Pine
Strategy parameters
Related strategies
Comment
All comments (0)
No data
- 1