RSI 신호선 교차를 기반으로 한 다중 기간 추세 추종 거래 전략

RSI MA RMA EMA SMA TMA ARSI
생성 날짜: 2025-02-18 15:04:49 마지막으로 수정됨: 2025-02-18 15:04:49
복사: 1 클릭수: 358
avatar of ChaoZhang ChaoZhang
1
집중하다
1617
수행원

RSI 신호선 교차를 기반으로 한 다중 기간 추세 추종 거래 전략

개요

이 전략은 강화형 상대적으로 약한 지표 ((RSI) 를 기반으로 한 트렌드 추적 거래 시스템이다. RSI의 개선된 버전을 계산하고 그 신호선을 결합하여 다양한 시장 주기에서 트렌드 반전 기회를 잡는다. 이 전략은 지표 값을 계산하는 것뿐만 아니라 시각적으로 초과 구매 및 초과 판매 지역을 표시하여 거래자가 시장 상태를 더 직관적으로 판단하도록 돕는다.

전략 원칙

전략의 핵심 원칙은 강화형 RSI ((ARSI) 의 계산을 통해 시장 추세를 식별하는 것이다. 구체적으로 다음을 포함한다:

  1. 정해진 기간 동안의 최고 가격과 최저 가격을 계산하여 가격 범위를 얻습니다.
  2. 가격변동에 따른 차이는
  3. 선택 가능한 이동 평균 방법 (EMA, SMA, RMA, TMA) 을 사용하여 차이는 부드럽게 처리
  4. 0-100 범위로 표준화 합니다.
  5. ARSI가 50 이하의 신호선을 통과하면 다중 신호가 발생
  6. ARSI가 50 이상의 신호선을 넘어갈 때 공백 신호가 발생

전략적 이점

  1. 신호 확인 메커니즘 개선 - ARSI와 신호 라인의 교차 및 중축 필터링을 통해 신호의 신뢰성을 보장
  2. 유연성 - 다양한 이동 평균 방법을 지원하고 시장 특성에 따라 조정할 수 있습니다.
  3. 합리적인 위험 관리 - 포지션 비율 관리 방법을 사용하여 거래 당 위험을 효과적으로 제어하십시오.
  4. 시각적 효과 돋보이는 - 과매도 영역을 색상으로 채워서 명확하게 표시하여 신속하게 판단할 수 있습니다.
  5. 역거래 관리 - 역거래 신호가 발생했을 때 자동으로 기존 지점을 매각하여 양방향 지점 위험을 방지합니다.

전략적 위험

  1. 변동 시장 위험 - 수평 변동 현상에서 빈번한 잘못된 신호가 발생할 수 있습니다.
  2. 지연 위험 - 이동 평균 계산을 사용하면 신호가 지연 될 수 있습니다.
  3. 매개 변수 민감성 - 다른 매개 변수 설정으로 인해 정책 성능에 큰 차이가 발생할 수 있습니다.
  4. 시장 적응성 위험 - 전략이 다른 시장 환경에서 크게 달라질 수 있습니다.
  5. 자금 관리 위험 - 고정 비율 포지션 관리는 급격한 변동이 있을 때 더 큰 위험을 초래할 수 있습니다.

전략 최적화 방향

  1. 변동율 필터를 도입 - 낮은 변동율 환경에서 거래 신호를 필터링하기 위해 ATR 지표를 추가할 수 있습니다.
  2. 트렌드 확인 지표 증가 - 더 긴 주기 트렌드 지표와 결합하여 신호 신뢰도를 높인다.
  3. 포지션 관리를 최적화 - 시장의 변동성에 따라 포지션 비율을 조정
  4. 스톱 메커니즘에 가입 - ATR 기반의 동적 스톱을 설정하여 위험을 더 잘 제어합니다.
  5. 적응 변수 개발 - 전략 적응성을 높이기 위해 변수의 동적 최적화 방법을 연구합니다.

요약하다

이것은 구조가 완전하고, 논리가 명확한 트렌드 추적 전략이다. 강화된 RSI의 혁신적인 계산 방법을 통해, 여러 가지 기술 지표의 장점을 결합하여, 신뢰할 수 있는 거래 시스템을 형성한다. 일부 고유한 위험이 있지만, 합리적인 최적화 및 위험 관리 조치를 통해, 이 전략은 실전 응용에 좋은 전망을 가지고 있다.

전략 소스 코드
/*backtest
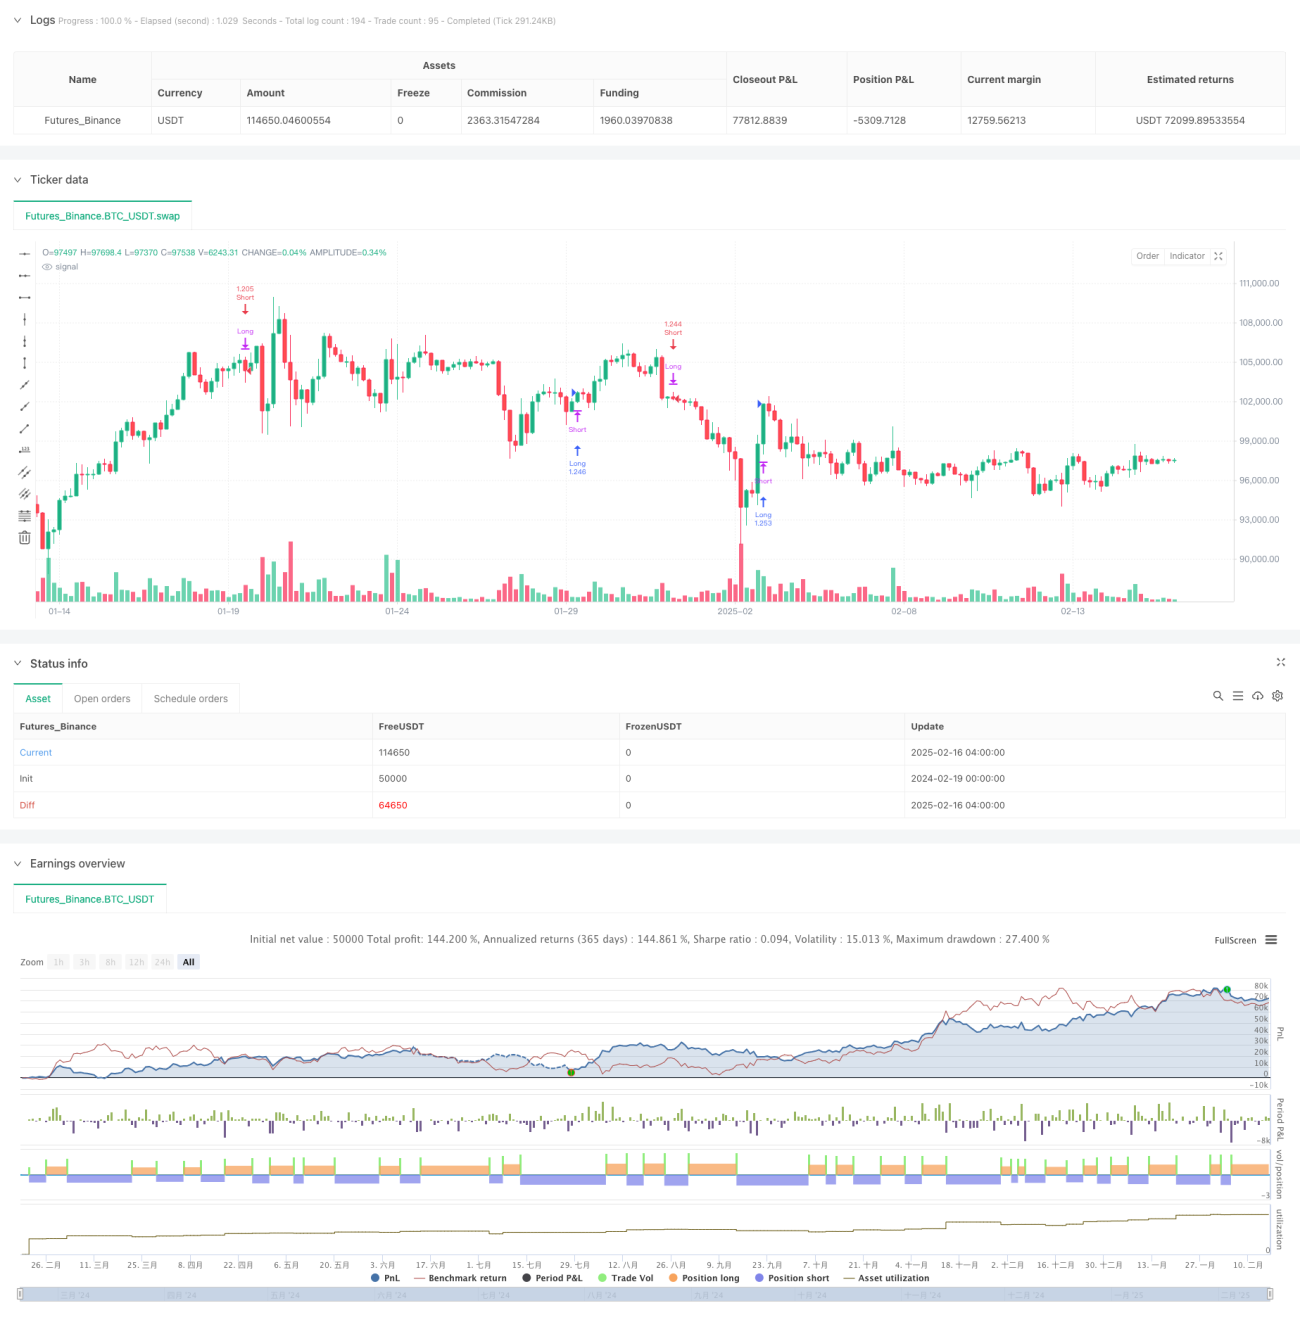
start: 2024-02-19 00:00:00
end: 2025-02-16 08:00:00
period: 4h
basePeriod: 4h
exchanges: [{"eid":"Futures_Binance","currency":"BTC_USDT"}]
*/

//@version=6
strategy("Ultimate RSI [LuxAlgo] Strategy", shorttitle="ULT RSI Strat", overlay=false, initial_capital=10000, currency=currency.USD, default_qty_type=strategy.percent_of_equity, default_qty_value=100)

//------------------------------------------------------------------------------
// Settings
//------------------------------------------------------------------------------
length    = input.int(14, minval=2, title="RSI Length")
smoType1  = input.string("RMA", title="Method", options=["EMA", "SMA", "RMA", "TMA"])
src       = input(close, title="Source")

arsiCss   = input.color(color.silver, "RSI Color", inline="rsicss")
autoCss   = input.bool(true, "Auto", inline="rsicss")

// Signal Line settings
smooth    = input.int(14, minval=1, title="Signal Smooth", group="Signal Line")
smoType2  = input.string("EMA", title="Method", options=["EMA", "SMA", "RMA", "TMA"], group="Signal Line")
signalCss = input.color(color.new(#ff5d00, 0), "Signal Color", group="Signal Line")

// Overbought/Oversold style
obValue     = input.float(80, "Overbought", inline="ob", group="OB/OS Style")
obCss       = input.color(color.new(#089981, 0), "", inline="ob", group="OB/OS Style")
obAreaCss   = input.color(color.new(#089981, 80), "", inline="ob", group="OB/OS Style")

osValue     = input.float(20, "Oversold", inline="os", group="OB/OS Style")
osCss       = input.color(color.new(#f23645, 0), "", inline="os", group="OB/OS Style")
osAreaCss   = input.color(color.new(#f23645, 80), "", inline="os", group="OB/OS Style")

//------------------------------------------------------------------------------
// Function: Moving Average (selectable type)
//------------------------------------------------------------------------------
ma(x, len, maType)=>
    switch maType
        "EMA" => ta.ema(x, len)
        "SMA" => ta.sma(x, len)
        "RMA" => ta.rma(x, len)
        "TMA" => ta.sma(ta.sma(x, len), len)
 
//------------------------------------------------------------------------------
// Augmented RSI Calculation
//------------------------------------------------------------------------------
upper = ta.highest(src, length)
lower = ta.lowest(src, length)
r     = upper - lower

d     = src - src[1]
diff  = upper > upper[1] ? r : lower < lower[1] ? -r : d

num   = ma(diff, length, smoType1)
den   = ma(math.abs(diff), length, smoType1)
arsi  = den != 0 ? num / den * 50 + 50 : 50  // safeguard against division by zero

signal = ma(arsi, smooth, smoType2)

//------------------------------------------------------------------------------
// Strategy Entry Conditions
//------------------------------------------------------------------------------
// Long entry: Ultimate RSI crosses above its signal when it is below 50 (lower half)
// Short entry: Ultimate RSI crosses below its signal when it is above 50 (upper half)
longCondition  = ta.crossover(arsi, signal) and arsi < 50
shortCondition = ta.crossunder(arsi, signal) and arsi > 50

// Close opposite positions when conditions occur
if shortCondition
    strategy.close("Long")
if longCondition
    strategy.close("Short")

// Place new entries based on the conditions
if longCondition
    strategy.entry("Long", strategy.long)
if shortCondition
    strategy.entry("Short", strategy.short)

// //------------------------------------------------------------------------------
// // Plots and Constant Lines
// //------------------------------------------------------------------------------
// // Plot the Ultimate RSI and its Signal
// plot_rsi = plot(arsi, title="Ultimate RSI",
//      color = arsi > obValue ? obCss : arsi < osValue ? osCss : autoCss ? chart.fg_color : arsiCss,
//      linewidth=2)
// plot(signal, title="Signal Line", color=signalCss, linewidth=2)

// // Instead of using hline, create constant plots for OB, Midline, and OS
// plot_ob  = plot(obValue, title="Overbought", color=obCss, style=plot.style_line, linewidth=1)
// plot_mid = plot(50, title="Midline", color=color.gray, style=plot.style_line, linewidth=1)
// plot_os  = plot(osValue, title="Oversold", color=osCss, style=plot.style_line, linewidth=1)

// //------------------------------------------------------------------------------
// // Fill OB/OS Areas for Visual Clarity
// //------------------------------------------------------------------------------
// fill(plot_rsi, plot_ob, color=arsi > obValue ? obAreaCss : na)
// fill(plot_os, plot_rsi, color=arsi < osValue ? osAreaCss : na)