ATR 동적 추세 추적 및 재진입 거래 전략

ATR SMA MA
생성 날짜: 2025-02-18 15:11:28 마지막으로 수정됨: 2025-02-18 15:11:28
복사: 1 클릭수: 362
avatar of ChaoZhang ChaoZhang
1
집중하다
1617
수행원

ATR 동적 추세 추적 및 재진입 거래 전략

개요

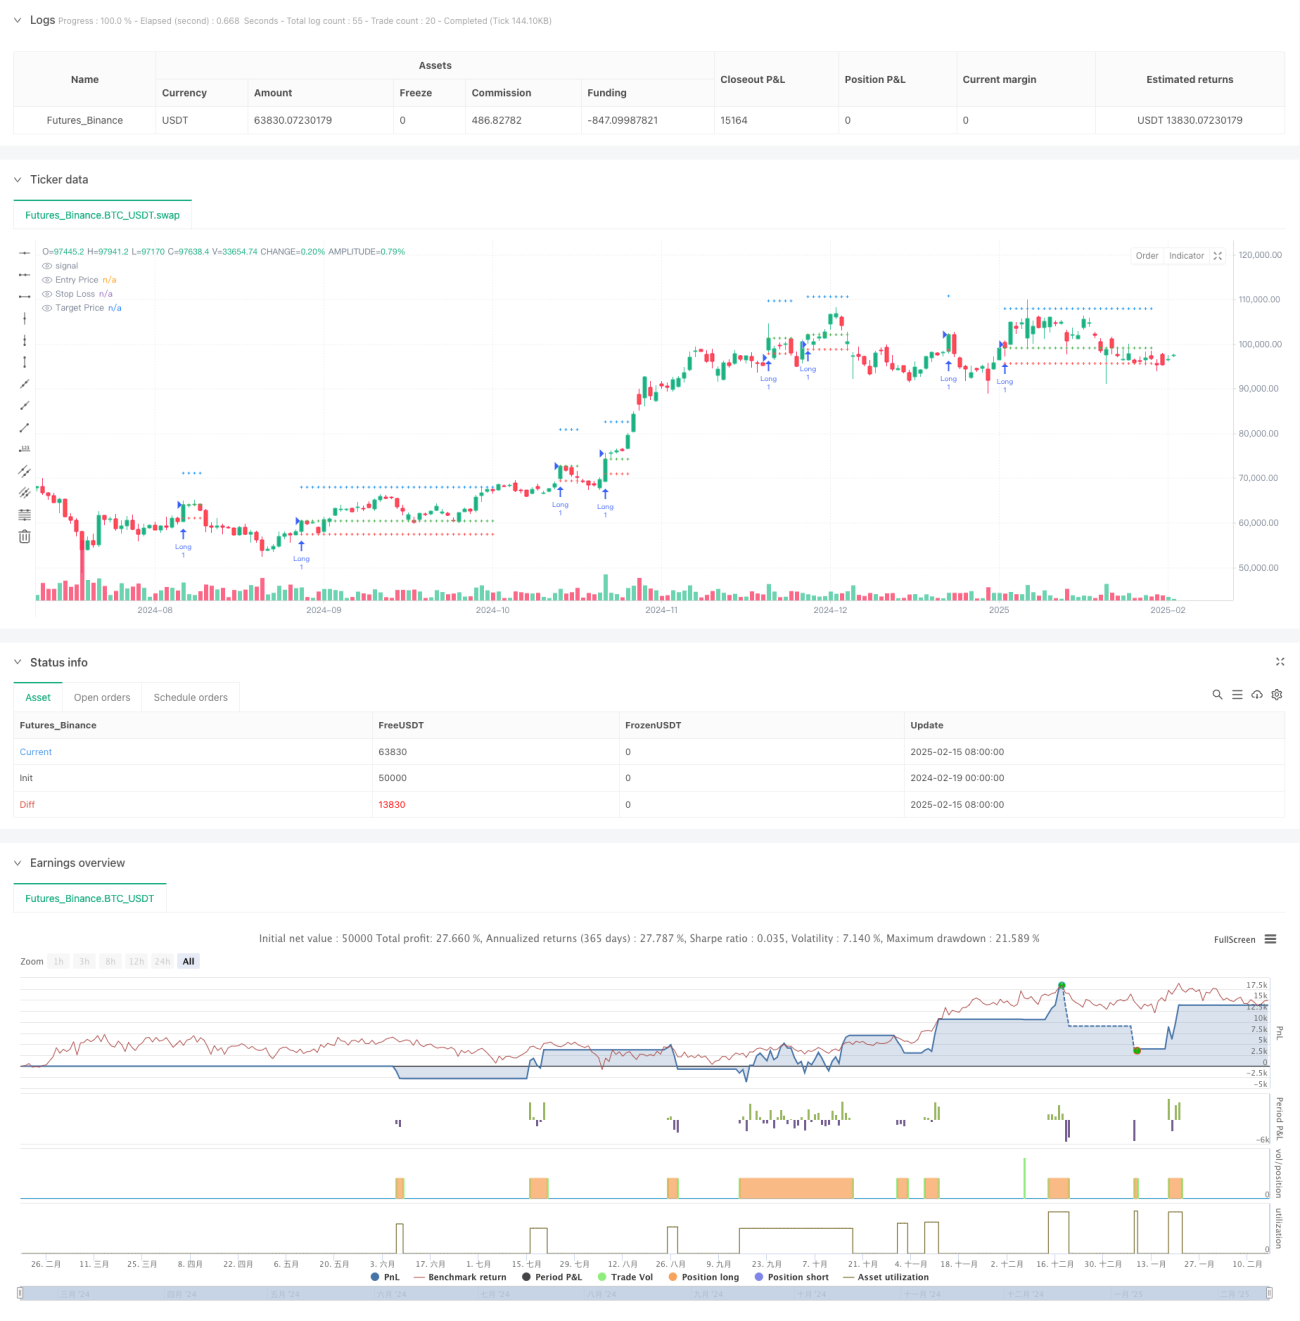
이것은 ATR 동적 조정에 기반한 트렌드 추적 전략으로, 이동 평균과 ATR 지표가 결합되어 입점과 출구를 결정한다. 이 전략의 핵심 특징은 ATR 동적 조정으로 이동 평균의 상하 궤도를, 가격이 궤도를 돌파할 때 입지를 더 많이 하고, ATR 배수에 기반한 중지 및 중지 지점을 설정하는 것이다. 한편, 이 전략은 혁신적인 재입장 메커니즘을 포함하고 있으며, 가격이 입점으로 다시 이동할 때 다시 입지를 구축할 수 있다.

전략 원칙

이 전략은 다음과 같은 몇 가지 핵심 요소를 기반으로 작동합니다.

  1. ATR 조정된 이동 평균을 트렌드 판단 기준으로 사용하여 동적인 상하 궤도를 형성합니다.
  2. 가격 돌파가 경로를 돌파 할 때 여러 신호가 생성되며, 입시 가격은 현재 종료 가격입니다.
  3. 입점 가격 아래 2배의 ATR 거리로 설정
  4. 정지 시점은 입점 가격 위에 설정되어 있습니다.
  5. 정지 또는 정지 트리거 후, 가격이 원래 입시 가격으로 되돌리면 전략은 자동으로 다시 입시합니다.
  6. 최대 30 K 선의 표시 제한을 사용하여 그래프 표시를 최적화합니다.

전략적 이점

  1. 동적 적응력: ATR에 의해 조정된 이동 평균은 시장의 변동률 변화에 적응합니다.
  2. 위험 관리 과학: 시장의 변동 특성에 맞는 ATR의 동적 설정을 기반으로 한 중단 및 중단
  3. 재입장 메커니즘 혁신: 가격 회귀가 유리한 위치에 있을 때 재입장을 허용하여 수익을 올릴 수 있다.
  4. 뛰어난 시각화 효과: 전략은 명확한 입시, 중단, 중지 라인을 제공하여 거래를 모니터링 할 수 있습니다.
  5. 매개 변수 유연성: 입력 매개 변수를 통해 트렌드 판단 주기 및 정지배수를 조정할 수 있다

전략적 위험

  1. 트렌드 리버스 위험: 불안한 시장에서 자주 스톱 손실을 유발할 수 있습니다.
  2. 재입장 위험: 입점으로의 가격 회귀로 인해 재창조가 연속적으로 중단될 수 있습니다.
  3. 슬라이드 포인트 위험: 급격한 변동 기간 동안 실제 거래 가격이 신호 가격과 오차가있을 수 있습니다.
  4. 매개 변수 민감성: 시장 조건에 따라 최적 매개 변수가 크게 변할 수 있다
  5. 계산 부하: 여러 기술 지표를 실시간으로 계산해야 하며, 시스템 부하를 증가시킬 수 있다.

전략 최적화 방향

  1. 시장 환경 필터를 도입: 변동률 필터를 추가하여 높은 변동성 동안 전략 매개 변수를 조정하거나 거래를 중지할 수 있습니다.
  2. 최적화된 재입장 논리: 트렌드 확인 지표와 같은 재입장 시 더 엄격한 조건 제한을 고려할 수 있습니다.
  3. 개선된 스톱 메커니즘: 이동식 스톱 기능으로 트렌드가 지속될 때 더 많은 수익을 보호할 수 있습니다.
  4. 시간 필터를 추가: 거래 시간 제한을 추가하여 낮은 유동성 기간을 피할 수 있습니다.
  5. 계산 효율을 최적화: 불필요한 계산과 도면을 줄임으로써 전략 운영 효율을 향상시킬 수 있다

요약하다

이것은 합리적이고, 논리적으로 명확하게 설계된 트렌드 추적 전략이며, ATR의 동적 조정을 통해 좋은 시장 적응력을 제공합니다. 전략의 재입장 메커니즘은 좋은 시장 조건에서 추가적인 수익 기회를 제공할 수 있는 혁신적인 점입니다. 주의해야 할 몇 가지 위험점이 있지만, 제안된 최적화 방향은 전략의 안정성과 수익성을 더욱 향상시킬 수 있습니다. 체계화된 거래 방법을 찾는 투자자에게는 고려할 가치가 있는 기본 전략 프레임워크입니다.

전략 소스 코드
/*backtest
start: 2024-02-19 00:00:00
end: 2025-02-16 08:00:00
period: 1d
basePeriod: 1d
exchanges: [{"eid":"Futures_Binance","currency":"BTC_USDT"}]
*/

//@version=6
strategy("KON SET By Sai", overlay=true, max_lines_count=40)

// INPUTS
length = input.int(10, "Trend Length")
target_multiplier = input.int(0, "Set Targets") // Target adjustment
max_bars = 30  // Number of bars to display the lines after signal

// VARIABLES
var bool inTrade = false
var float entryPrice = na
var float stopLoss = na
var float targetPrice = na
var int barCount = na  // Counter to track how many bars have passed since signal

// ATR for stop-loss and target calculation
atr_value = ta.sma(ta.atr(200), 200) * 0.8

// Moving averages for trend detection
sma_high = ta.sma(high, length) + atr_value
sma_low = ta.sma(low, length) - atr_value

// Signal conditions for trend changes
signal_up = ta.crossover(close, sma_high)
signal_down = ta.crossunder(close, sma_low)

// Entry conditions
if not inTrade and signal_up
    entryPrice := close
    stopLoss := close - atr_value * 2
    targetPrice := close + atr_value * (5 + target_multiplier)
    strategy.entry("Long", strategy.long)
    strategy.exit("Exit Long", "Long", stop=stopLoss, limit=targetPrice)
    inTrade := true
    barCount := 0  // Reset bar count when signal occurs

// Exit conditions
if inTrade and (close <= stopLoss or close >= targetPrice)
    inTrade := false
    entryPrice := na
    stopLoss := na
    targetPrice := na
    barCount := na  // Reset bar count on exit

// Re-entry logic
if not inTrade and close == entryPrice
    entryPrice := close
    stopLoss := close - atr_value * 2
    targetPrice := close + atr_value * (5 + target_multiplier)
    strategy.entry("Re-Long", strategy.long)
    strategy.exit("Re-Exit Long", "Re-Long", stop=stopLoss, limit=targetPrice)
    inTrade := true
    barCount := 0  // Reset bar count when re-entry happens

// Count bars since the signal appeared (max 30 bars)
if inTrade and barCount < max_bars
    barCount := barCount + 1

// Plotting lines for entry, stop-loss, and targets (Only during active trade and within max_bars)
entry_line = plot(inTrade and barCount <= max_bars ? entryPrice : na, title="Entry Price", color=color.new(color.green, 0), linewidth=1, style=plot.style_cross)
sl_line = plot(inTrade and barCount <= max_bars ? stopLoss : na, title="Stop Loss", color=color.new(color.red, 0), linewidth=1, style=plot.style_cross)
target_line = plot(inTrade and barCount <= max_bars ? targetPrice : na, title="Target Price", color=color.new(color.blue, 0), linewidth=1, style=plot.style_cross)

// Background color between entry and target/stop-loss (Only when inTrade and within max_bars)
fill(entry_line, target_line, color=color.new(color.green, 90), title="Target Zone")
fill(entry_line, sl_line, color=color.new(color.red, 90), title="Stop-Loss Zone")

// Label updates (reduce overlap and clutter)
if bar_index % 50 == 0 and inTrade and barCount <= max_bars  // Adjust label frequency for performance
    label.new(bar_index + 1, entryPrice, text="Entry: " + str.tostring(entryPrice, "#.##"), style=label.style_label_left, color=color.green, textcolor=color.white, size=size.small)
    label.new(bar_index + 1, stopLoss, text="Stop Loss: " + str.tostring(stopLoss, "#.##"), style=label.style_label_left, color=color.red, textcolor=color.white, size=size.small)
    label.new(bar_index + 1, targetPrice, text="Target: " + str.tostring(targetPrice, "#.##"), style=label.style_label_left, color=color.blue, textcolor=color.white, size=size.small)