동적 선형 회귀 채널 및 Heinz 종료 최적화 거래 전략

LR HA TP/SL VOL STD
생성 날짜: 2025-02-18 15:18:08 마지막으로 수정됨: 2025-02-18 15:18:08
복사: 2 클릭수: 374
avatar of ChaoZhang ChaoZhang
1
집중하다
1617
수행원

동적 선형 회귀 채널 및 Heinz 종료 최적화 거래 전략

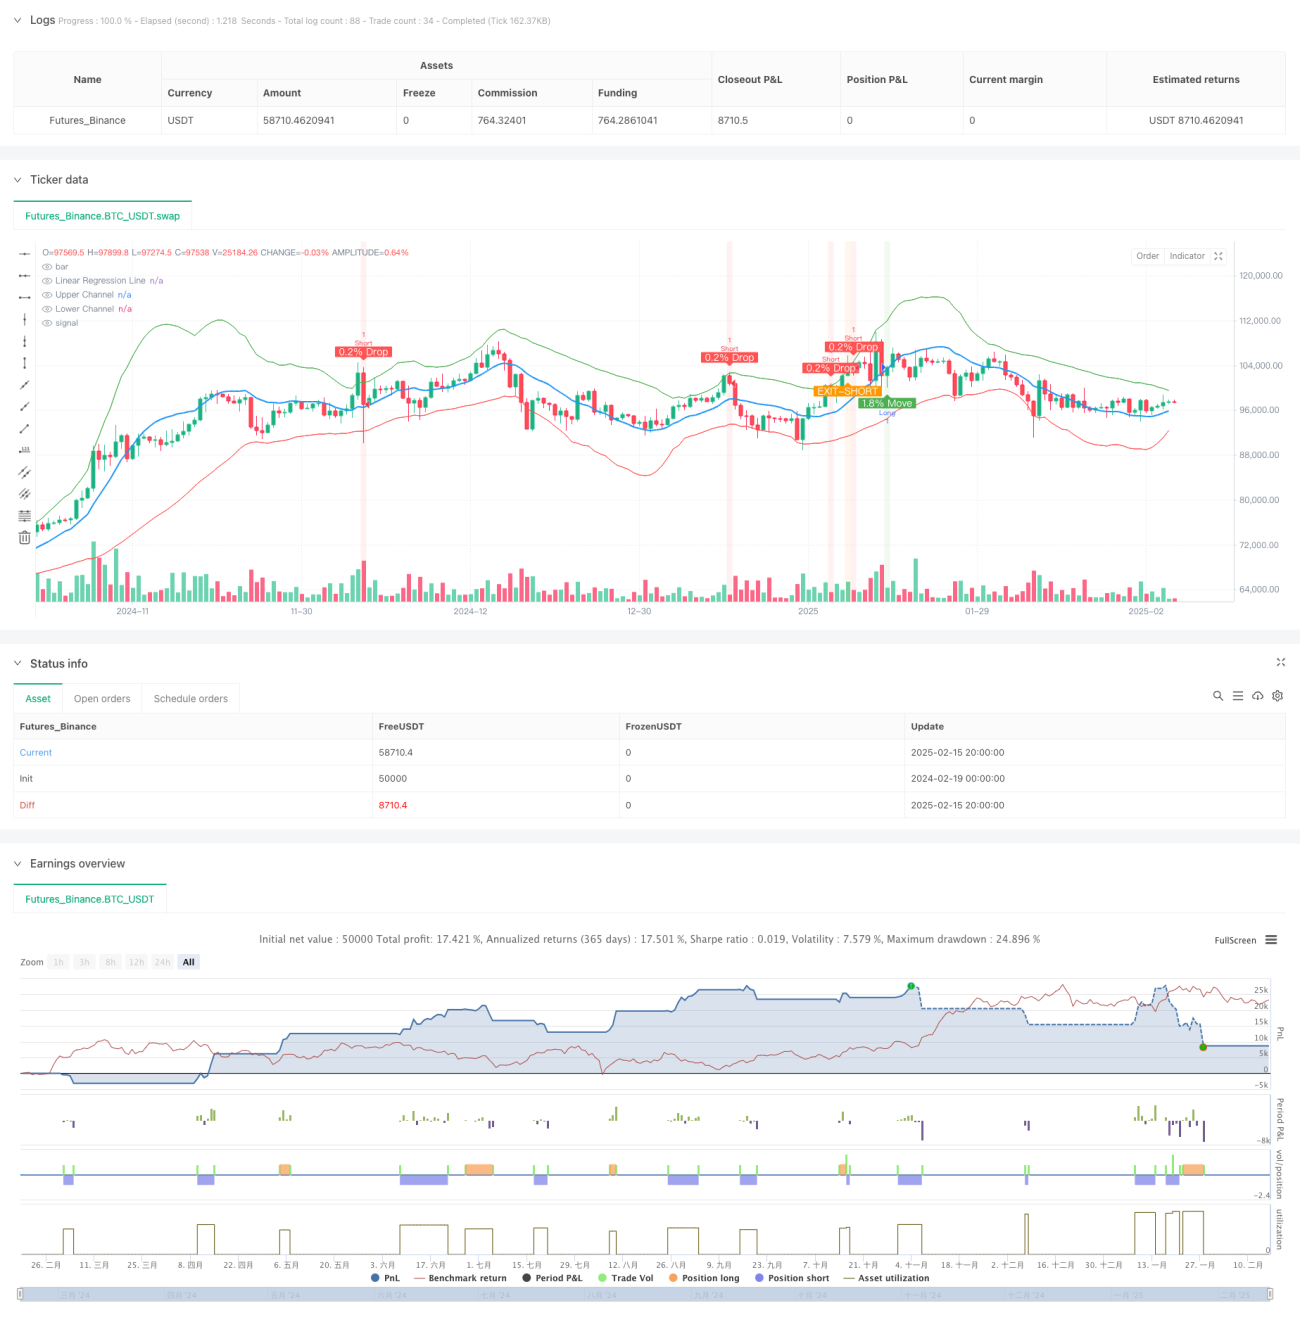
이 전략은 선형 회귀 통로와 하인 앤스 그래프에 기반한 정량 거래 시스템으로, 동적 스톱 스톱 손실 메커니즘을 결합하여 시장의 급격한 변동 기회를 잡기 위해 고안되었습니다.

전략 개요

이 전략은 선형 회귀 통로를 주요 거래 프레임 워크로 사용하여 통로 내의 가격 움직임을 모니터링하여 잠재적인 거래 기회를 식별합니다. 가격이 통로 하향 경로를 돌파하고 1.8% 이상의 상승이 발생할 때, 시스템은 여러 신호를 냅니다. 가격이 통로 상향 경로를 돌파하고 0.2% 이상의 하락이 발생할 때, 시스템은 공백을 냅니다.

전략 원칙

전략의 핵심은 30주기에 대한 선형 회귀 계산에 기초하여 표준 차이의 2배로 통로 폭을 설정하는 것이다. 입시 신호는 다음과 같은 조건에 기초한다:

  1. 다수의 입장은 가격이 하락한 후 1.8% 이상의 상승이 발생하고 2 시간 동안 5% 이상의 상승이 발생하지 않도록 요구합니다.
  2. 공허 입장은 0.2% 이상의 하락으로 가격이 경로를 돌파합니다.
  3. 3분 시간 프레임의 하이엔스 지도를 사용하여 출전 시간을 결정합니다.
  4. 10%의 스피드 스과 5%의 스톱 로즈가 리스크를 제어하기 위해 설정되어 있습니다.

전략적 이점

  1. 트렌드와 역거래의 특성을 결합하여 빠른 시장 기회를 잡을 수 있습니다.
  2. 하이엔스 도표를 출전 지표로 사용하여 더 안정적인 출전 메커니즘을 제공합니다
  3. 명확한 위험 제어 조치, 즉, 스톱 스톱 손실 설정
  4. 선형 회귀 채널을 통해 시장 소음을 필터링하여 신호 품질을 향상
  5. 가격의 장기적 움직임을 고려하고, 급격한 상승 이후 더 많은 것을 피하는 방법

전략적 위험

  1. 높은 변동성 시장에서 자주 중단되는 경우
  2. 급격한 반동에 대한 시장의 반응은 느릴 수 있습니다.
  3. 고정 스톱 스톱 손실 비율은 모든 시장 환경에 적합하지 않을 수 있습니다.
  4. 위축 시장에서 너무 많은 가짜 신호가 발생할 수 있습니다.
  5. 실시간 데이터 계산이 필요하며 실행 속도에 대한 요구 사항이 있습니다.

전략 최적화 방향

  1. 시장의 변동에 따라 중지 손실 비율을 조정하는 것이 좋습니다.
  2. 트랜지션 지표가 신호 확인으로 추가될 수 있습니다.
  3. 적응된 선형 회귀주기를 도입하는 것을 고려한다
  4. 하이엔스의 출전 조건을 최적화하기 위해 추가 확정 지표가 필요할 수 있습니다.
  5. 거래 시간 필터를 추가하여 유동성이 낮은 시간에 거래를 피하는 것이 좋습니다.

요약하다

이 전략은 선형 회귀 통로와 가격 돌파구를 결합하는 방식으로 거래자에게 비교적 완전한 거래 시스템을 제공합니다. 이 전략은 여러 가지 기술 지표와 위험 제어 조치를 결합하고 있지만 실제 시장 상황에 따라 최적화 및 조정해야 합니다. 실물 거래 전에 충분한 피드백과 변수 최적화가 권장됩니다.

전략 소스 코드
/*backtest
start: 2024-02-19 00:00:00
end: 2025-02-16 08:00:00
period: 12h
basePeriod: 12h
exchanges: [{"eid":"Futures_Binance","currency":"BTC_USDT"}]
*/

//@version=6
strategy('STRATEGY WITH SL', overlay=true)

// Parameters for Linear Regression
length = input.int(30, title='Linear Regression Length')  
mult = input.float(2.0, title='Channel Multiplier', step=0.1)  

// Calculate Linear Regression
regression_line = ta.linreg(close, length, 0)

// Calculate Standard Deviation
stddev = ta.stdev(close, length)

// Upper and Lower Channel Boundaries
upper_channel = regression_line + mult * stddev
lower_channel = regression_line - mult * stddev

// Plot the Linear Regression and Channel
plot(regression_line, color=color.blue, linewidth=2, title='Linear Regression Line')
plot(upper_channel, color=color.green, linewidth=1, title='Upper Channel')
plot(lower_channel, color=color.red, linewidth=1, title='Lower Channel')

// Parameters for Price Move Check (Indicator 1: 1.8% Move)
threshold_move = 1.8 
large_threshold_move = 5.0  
timeframe_for_large_move = 120  

// Calculate the percentage change over the last 3 minutes
priceChange = (close - close[3]) / close[3] * 100

// Calculate the percentage change over the last 2 hours (120 minutes)
priceChange2Hour = (close - close[120]) / close[120] * 100

// Condition for a price move greater than 1.8%
isPriceUp = priceChange > threshold_move

// Condition for price move greater than 5% in 2 hours (no alert if true)
isLargePriceMove = priceChange2Hour > large_threshold_move

// Parameters for Price Drop Check (Indicator 2: 0.2% Drop)
threshold_drop = 0.2 / 100  // 0.2% threshold

// Get the price 3 minutes ago
price_3min_ago = request.security(syminfo.tickerid, '3', close[1])

// Calculate the percentage drop over the last 3 minutes
price_drop = (close - price_3min_ago) / price_3min_ago

// Condition for a 0.2% drop
drop_condition = price_drop <= -threshold_drop

// Track whether the price has crossed the upper or lower Linear Regression channel
var bool lower_crossed = false
var bool upper_crossed = false
var bool move_after_cross = false  
var bool alert_sent = false

// Reset flags when price crosses channels
if (close < lower_channel)
    lower_crossed := true
    move_after_cross := false

if (close > upper_channel)
    upper_crossed := true
    alert_sent := false  

// Combine both conditions for price crossing lower and upper channels and move/drop conditions
final_condition_long = lower_crossed and isPriceUp and not move_after_cross and not isLargePriceMove
final_condition_short = upper_crossed and drop_condition and not alert_sent

// Set flags when conditions are met
if (final_condition_long)
    move_after_cross := true

if (final_condition_short)
    alert_sent := true

// Heikin-Ashi calculation for dynamic timeframe (3-minute)
heikin_open = (open + close) / 2
heikin_close = (open + high + low + close) / 4
heikin_high = math.max(high, math.max(heikin_open, heikin_close))
heikin_low = math.min(low, math.min(heikin_open, heikin_close))

// Conditions for EXIT signals based on Heikin-Ashi candle body
exit_long_condition = (heikin_open > lower_channel and heikin_close < lower_channel) or (heikin_open < lower_channel and heikin_close > lower_channel)
exit_short_condition = heikin_open < upper_channel and heikin_close > upper_channel

// Strategy logic: Enter long or short based on the combined conditions

// Long Entry Condition
if (final_condition_long)
    strategy.entry('Long', strategy.long)

// Short Entry Condition
if (final_condition_short)
    strategy.entry('Short', strategy.short)

// Exit Conditions (EXIT-LONG and EXIT-SHORT)
if (exit_long_condition)
    strategy.close('Long')

if (exit_short_condition)
    strategy.close('Short')

// Take Profit and Stop Loss
take_profit = 10 / 100  // 10% Take Profit
stop_loss = 5 / 100    // 5% Stop Loss

// Calculate Take Profit and Stop Loss levels based on entry price
long_take_profit = strategy.position_avg_price * (1 + take_profit)
long_stop_loss = strategy.position_avg_price * (1 - stop_loss)

short_take_profit = strategy.position_avg_price * (1 - take_profit)
short_stop_loss = strategy.position_avg_price * (1 + stop_loss)

// Apply Take Profit and Stop Loss for Long and Short positions
strategy.exit('Take Profit/Stop Loss Long', from_entry='Long', limit=long_take_profit, stop=long_stop_loss)
strategy.exit('Take Profit/Stop Loss Short', from_entry='Short', limit=short_take_profit, stop=short_stop_loss)

// Plot background color when the conditions are met (for visual aid)
bgcolor(final_condition_long ? color.new(color.green, 90) : na, title='Price Move Alert After Lower Channel Crossed')
bgcolor(final_condition_short ? color.new(color.red, 90) : na, title='Price Drop Alert After Upper Channel Crossed')
bgcolor(exit_long_condition ? color.new(color.blue, 90) : na, title='EXIT-LONG Alert')
bgcolor(exit_short_condition ? color.new(color.orange, 90) : na, title='EXIT-SHORT Alert')

// Plot shapes when conditions are met
plotshape(final_condition_long, style=shape.labelup, location=location.belowbar, color=color.green, text='1.8% Move', textcolor=color.white, size=size.small)
plotshape(final_condition_short, style=shape.labeldown, location=location.abovebar, color=color.red, text='0.2% Drop', textcolor=color.white, size=size.small)
plotshape(exit_long_condition, style=shape.labeldown, location=location.abovebar, color=color.purple, text='EXIT-LONG', textcolor=color.white, size=size.small)
plotshape(exit_short_condition, style=shape.labelup, location=location.belowbar, color=color.orange, text='EXIT-SHORT', textcolor=color.white, size=size.small)

// Alert conditions for price moves and exits
alertcondition(final_condition_long, title="Price Move > 1.8% After Lower LR Channel Cross", message="Price crossed the lower Linear Regression Channel and moved more than 1.8% in the last 3 minutes!")
alertcondition(final_condition_short, title="Price Drop > 0.2% After Upper LR Channel Cross", message="Price crossed the upper Linear Regression Channel and dropped more than 0.2% in the last 3 minutes!")
alertcondition(exit_long_condition, title="EXIT-LONG: Heikin-Ashi Candle Body Crossing Lower LR Channel", message="The body of a 3-minute Heikin-Ashi candle is crossing outside the lower Linear Regression Channel.")
alertcondition(exit_short_condition, title="EXIT-SHORT: Heikin-Ashi Candle Body Crossing Upper LR Channel", message="The body of a 3-minute Heikin-Ashi candle is crossing outside the upper Linear Regression Channel.")