
1
Follow
1781
Followers
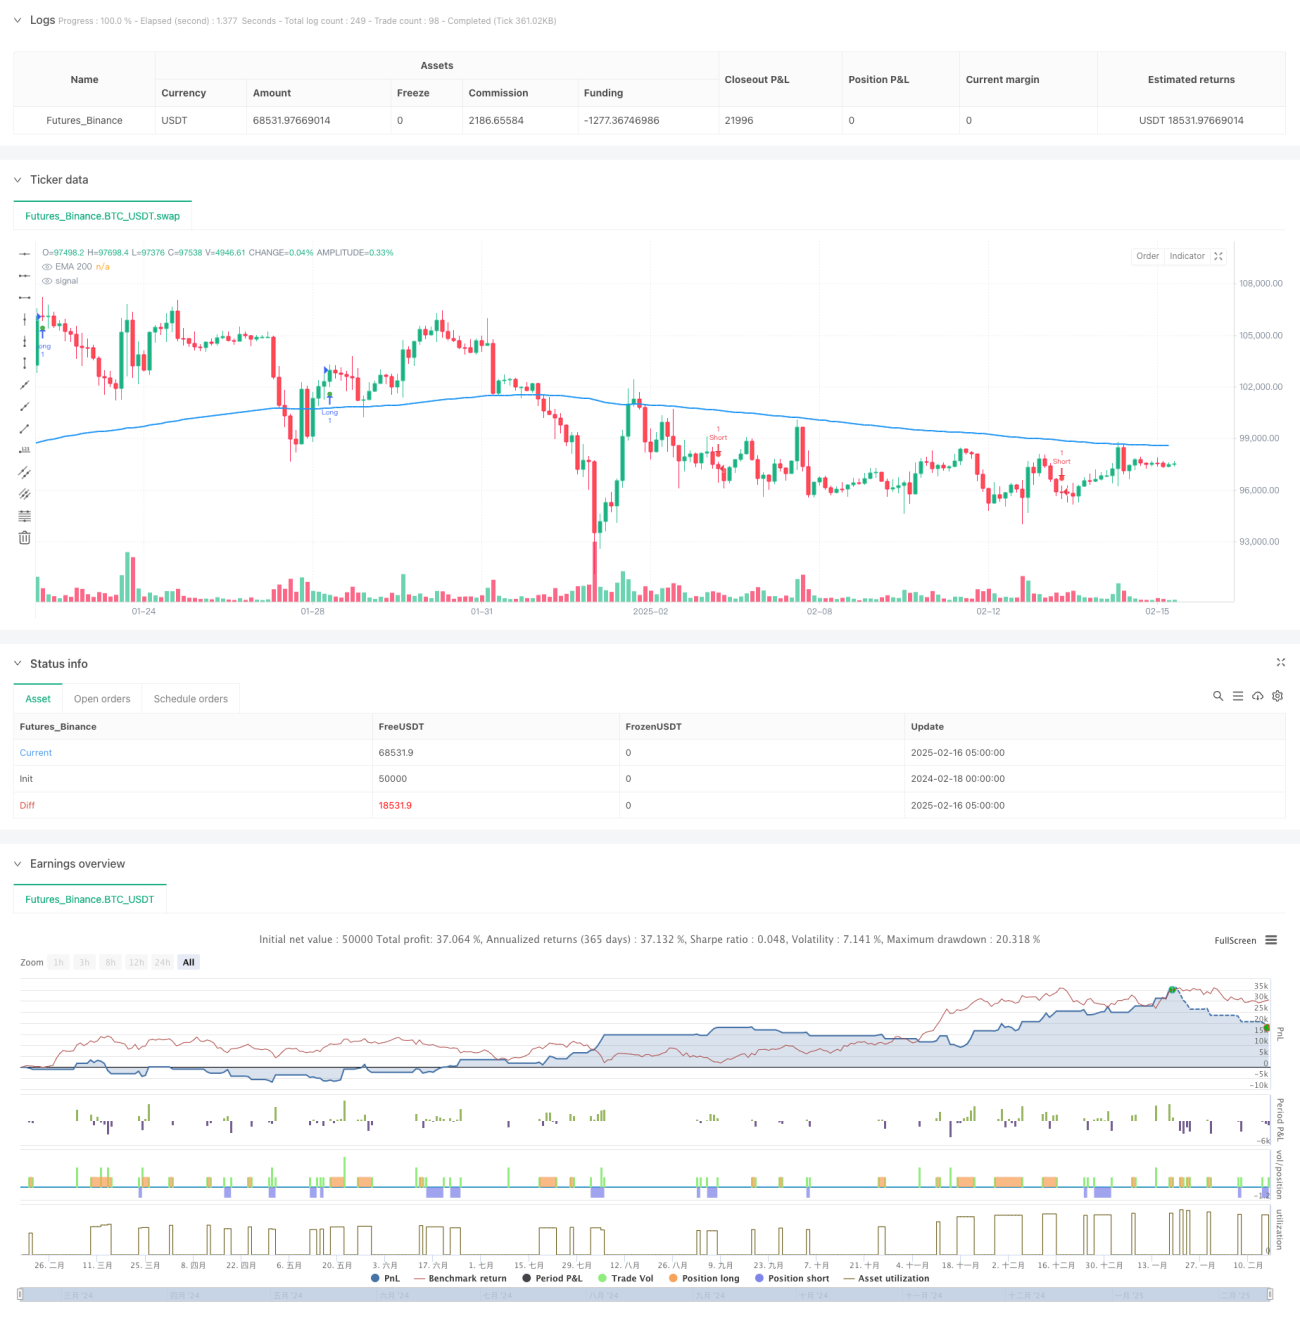
개요
이 전략은 다중 기술 지표에 기반한 통합 거래 시스템으로, 동력 지표, 트렌드 지표 및 변동률 지표를 결합하여 시장의 단기 변동 기회를 포착합니다. 이 전략은 MACD 교차 신호, EMA 트렌드 확인, RSI 초과 매매 조건 및 ADX 트렌드 강도 필터링을 통해 거래 기회를 식별하고 ATR 기반의 동적 스톱포드를 사용하여 위험을 관리합니다.
전략 원칙
전략의 핵심 논리는 다음과 같은 핵심 구성 요소를 기반으로 합니다.
- MACD 지표는 동력의 변화를 포착하고, 빠른 선과 느린 선의 교차로 입시 시기를 결정합니다.
- 200주기 EMA는 전체적인 트렌드 방향을 확인하는 데 사용되며, 가격이 평균선 위에 있는 것은 다면 트렌드라고 간주되며, 반대로 공중 트렌드입니다.
- RSI 지표는 가격 움직임을 확인하기 위해 사용되며, RSI>50은 더 많은 것을 지원하고, RSI<50은 더 적은 것을 지원합니다.
- ADX 지표는 약한 트렌드를 필터링하기 위해 사용되며, ADX가 설정된 스레드값보다 커질 때만 입시를 고려합니다.
- ATR 지표는 시장의 변동성에 따라 적응하는 스톱로스 및 스톱 포지션을 동적으로 계산합니다.
전략적 이점
- 다중 지표 크로스 검증, 신호 신뢰성 향상
- 동적 리스크 관리 시스템, 시장의 변동성에 따라 자동으로 조정되는 스톱 스<unk>
- 다양한 시장 조건에 따라 변수를 조정할 수 있는 유연성
- 전체적인 트렌드 확인 메커니즘, 가짜 돌파의 위험을 낮추는 것
- 체계화된 출전 논리, 주관적인 판단을 줄여주기
전략적 위험
- 여러 지표로 인해 신호 지연이 발생할 수 있습니다.
- 짧은 시간 사이클은 시장 소음에 취약합니다.
- 매개변수 최적화로 인해 과적합이 발생할 수 있습니다.
- 높은 주파수 거래는 높은 거래 비용을 초래할 수 있습니다.
- 시장의 급격한 변동이 발생할 경우 자주 중단될 수 있습니다.
전략 최적화 방향
- 보조 확인으로 볼륨 지표 도입
- ADX 마이너스를 최적화하여 트렌드 필터링 효율을 향상시킵니다.
- 시간 필터를 추가하여 유동성이 낮은 시기를 피하십시오.
- 전략적 안정성을 높이기 위해 적응 가능한 매개 변수 시스템을 개발합니다.
- 시장 변동율 필터에 참여하여 다양한 시장 환경에 대응하십시오.
요약하다
이 전략은 여러 가지 기술 지표를 통합하여 완전한 거래 시스템을 구축한다. 약간의 지연과 변수 최적화 과제가 있지만, 합리적인 위험 관리와 지속적인 최적화를 통해 전략은 더 나은 적응력과 신뢰성을 보여준다. 거래자는 실내 사용 전에 충분한 회수 및 변수 최적화를 수행하는 것이 좋습니다.
Source
Pine
Strategy parameters
Related strategies
Comment
All comments (0)
No data
- 1