가격 구조에 기반한 높은 비례 수익 돌파 거래 전략

RR SL TP ATH ATL
생성 날짜: 2025-02-18 15:42:01 마지막으로 수정됨: 2025-02-18 15:42:01
복사: 1 클릭수: 393
avatar of ChaoZhang ChaoZhang
1
집중하다
1617
수행원

가격 구조에 기반한 높은 비례 수익 돌파 거래 전략

개요

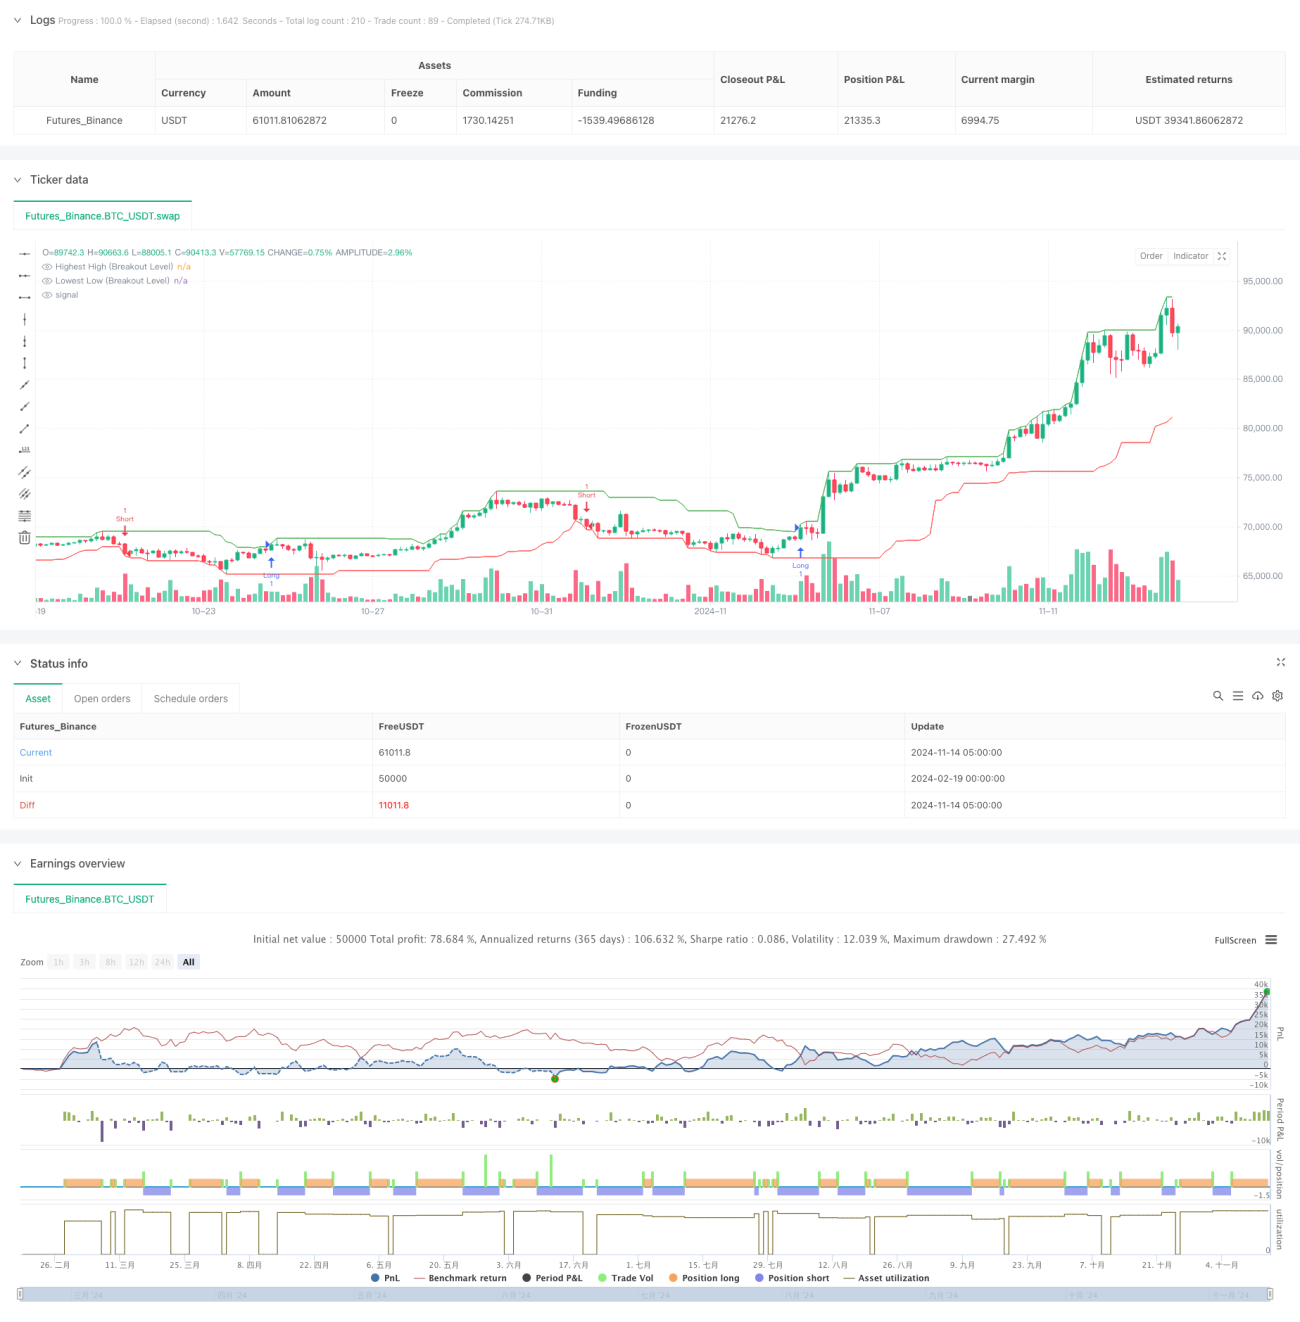
이것은 순수 가격 행동을 기반으로 한 돌파구 거래 전략이며, 1: 5의 높은 위험과 수익 비율을 사용하여 설계되었습니다. 전략은 중요한 가격 수준의 돌파구를 식별하여 거래를 수행하며, 시장 구조의 동적 설정 중단 및 수익 목표를 결합합니다. 전략은 어떤 기술 지표에도 의존하지 않으며, 실시간 가격 행동을 기반으로 거래 결정을 내립니다.

전략 원칙

전략의 핵심 논리는 다음과 같은 핵심 부분으로 구성됩니다.

  1. 상위 가격과 최저 가격 수준을 확인하여 거슬러 올라가는 과정을 통해 돌파구 기준점을 형성합니다.
  2. 종결 가격이 이전 고점을 돌파할 때 더 많은 포지션을 열고, 이전 저점을 돌파할 때 빈 포지션을 열고
  3. 근래의 변동에 기반하여 동적 스톱 포지션을 설정합니다. 다중 포지션은 낮은 곳에 스톱포지션을 설정하고, 빈 포지션은 높은 곳에 스톱포지션을 설정합니다.
  4. 1: 5의 리스크/이익 비율에 따라 수익 목표 위치를 계산합니다
  5. 하루 최대 거래 수 제한을 설정하여 과도한 거래를 피하십시오. 모든 거래 과정은 가격행동에 전적으로 기반하고, 어떤 기술적인 지표도 참고로 사용되지 않는다.

전략적 이점

  1. 순수 가격 행동 거래, 지표 지연으로 인한 방해를 피하기
  2. 높은 리스크와 수익률을 적용하여 거래당 잠재적인 수익은 리스크의 5배입니다.
  3. 동적 중지 손실 설정, 시장 구조에 따라 적응 조정
  4. 명확한 거래 신호 및 시각적 표시, 거래 실행을 용이하게
  5. 매개변수는 다양한 시장 환경에 적응하도록 매우 조정 가능합니다.
  6. 일일 거래 수 제한을 포함한 엄격한 위험 관리

전략적 위험

  1. 위기 시장에서 빈번한 가짜 브레이크 신호가 발생할 수 있습니다.
  2. 고위험의 수익률은 상대적으로 낮은 승률을 초래할 수 있다.
  3. 파격 이후의 회귀가 손실을 유발할 수 있습니다.
  4. 시장의 변동성이 전략에 영향을 미칠 수 있습니다.
  5. 수익 목표에 도달하기 위해서는 더 큰 가격 이동이 필요합니다.

완화 조치:

  • 트렌드 시장에서 이 전략을 사용하는 방법
  • 중요한 보도자료 중 거래를 피하십시오.
  • 합리적인 포지션 규모
  • 정기적으로 검사하고 최적화 매개 변수

전략 최적화 방향

  1. 트렌드 필터를 추가하여 주 트렌드 방향으로만 거래합니다.
  2. 거래량 확인 메커니즘을 추가하여 돌파구 신뢰도를 높여줍니다.
  3. 변동율에 따라 동적으로 조정된 리스크/이익비율
  4. 다중 시간 주기의 분석을 도입하여 거래의 정확성을 향상시킵니다.
  5. 더 똑똑한 손해제도 개발, 예를 들어 손해제도를 추적하는 것
  6. 시장 환경을 인식하는 기능을 추가하고, 전략 파라미터를 조정하는 데 적응

요약하다

이것은 엄격하고 논리적으로 명확한 가격 행동 거래 전략이다. 높은 위험과 이익 비율을 통해 위험을 효과적으로 제어하면서 상당한 수익을 추구한다. 전략의 장점은 순수한 가격 드라이브, 변수 유연한 조정, 위험 제어의 완벽함이다. 약간의 가짜 돌파의 위험이 있지만, 제안 된 최적화 방향은 전략의 안정성과 신뢰성을 더욱 향상시킬 수 있다. 이 전략은 추세가 명백한 시장 환경에서 사용하기에 적합하며 거래자는 거래 규율을 엄격하게 준수해야합니다.

전략 소스 코드
/*backtest
start: 2024-02-19 00:00:00
end: 2024-11-14 08:00:00
period: 3h
basePeriod: 3h
exchanges: [{"eid":"Futures_Binance","currency":"BTC_USDT"}]
*/

//@version=6
strategy("Filtered Price Action Breakout", overlay=true)

// === INPUTS ===
lookback = input.int(20, title="Breakout Lookback Period", minval=5)
stopLookback = input.int(10, title="Stop Loss Lookback Period", minval=3)
rrMultiplier = input.float(5.0, title="Risk-to-Reward Multiplier", step=0.1)
maxTradesPerDay = input.int(5, title="Max Trades Per Day", minval=1)

// Ensure there are enough bars for calculations
inRange = bar_index >= lookback

// === CALCULATIONS ===
// Highest high and lowest low over the 'lookback' period
highestHigh = ta.highest(high, lookback)
lowestLow = ta.lowest(low, lookback)

// Define breakout conditions (using previous bar's level)
bullBreakout = ta.crossover(close, highestHigh[1])
bearBreakout = ta.crossunder(close, lowestLow[1])

// Store breakout signals in variables to prevent inconsistencies
bullBreakoutSignal = bullBreakout
bearBreakoutSignal = bearBreakout

// Determine stop levels based on recent swing lows/highs
longStop = ta.lowest(low, stopLookback)
shortStop = ta.highest(high, stopLookback)

// Track number of trades per day (fixing boolean condition issue)
newDay = ta.change(time("D")) != 0
todayTrades = ta.barssince(newDay)
tradeCount = 0
if newDay
    tradeCount := 0
else
    tradeCount := tradeCount + 1

// === STRATEGY LOGIC: ENTRY & EXIT ===
if bullBreakoutSignal and tradeCount < maxTradesPerDay
    entryPrice = close
    stopLevel = longStop
    risk = entryPrice - stopLevel
    if risk > 0
        target = entryPrice + rrMultiplier * risk
        strategy.entry("Long", strategy.long)
        strategy.exit("Long Exit", from_entry="Long", stop=stopLevel, limit=target)
        tradeCount := tradeCount + 1
        
        // // Draw Markups
        // label.new(bar_index, entryPrice, text="Long Entry", color=color.green, textcolor=color.white, size=size.small, style=label.style_label_down)
        // line.new(x1=bar_index, y1=entryPrice, x2=bar_index + 5, y2=entryPrice, color=color.green, width=2)
        // line.new(x1=bar_index, y1=stopLevel, x2=bar_index + 5, y2=stopLevel, color=color.red, width=2, style=line.style_dotted)
        // line.new(x1=bar_index, y1=target, x2=bar_index + 5, y2=target, color=color.blue, width=2, style=line.style_dashed)
        // label.new(bar_index, stopLevel, text="Stop Loss", color=color.red, textcolor=color.white, size=size.small, style=label.style_label_down)
        // label.new(bar_index, target, text="Target", color=color.blue, textcolor=color.white, size=size.small, style=label.style_label_up)

if bearBreakoutSignal and tradeCount < maxTradesPerDay
    entryPrice = close
    stopLevel = shortStop
    risk = stopLevel - entryPrice
    if risk > 0
        target = entryPrice - rrMultiplier * risk
        strategy.entry("Short", strategy.short)
        strategy.exit("Short Exit", from_entry="Short", stop=stopLevel, limit=target)
        tradeCount := tradeCount + 1
        
        // // Draw Markups
        // label.new(bar_index, entryPrice, text="Short Entry", color=color.red, textcolor=color.white, size=size.small, style=label.style_label_up)
        // line.new(x1=bar_index, y1=entryPrice, x2=bar_index + 5, y2=entryPrice, color=color.red, width=2)
        // line.new(x1=bar_index, y1=stopLevel, x2=bar_index + 5, y2=stopLevel, color=color.green, width=2, style=line.style_dotted)
        // line.new(x1=bar_index, y1=target, x2=bar_index + 5, y2=target, color=color.blue, width=2, style=line.style_dashed)
        // label.new(bar_index, stopLevel, text="Stop Loss", color=color.green, textcolor=color.white, size=size.small, style=label.style_label_up)
        // label.new(bar_index, target, text="Target", color=color.blue, textcolor=color.white, size=size.small, style=label.style_label_down)

// === PLOTTING ===
plot(highestHigh, color=color.green, title="Highest High (Breakout Level)")
plot(lowestLow, color=color.red, title="Lowest Low (Breakout Level)")