
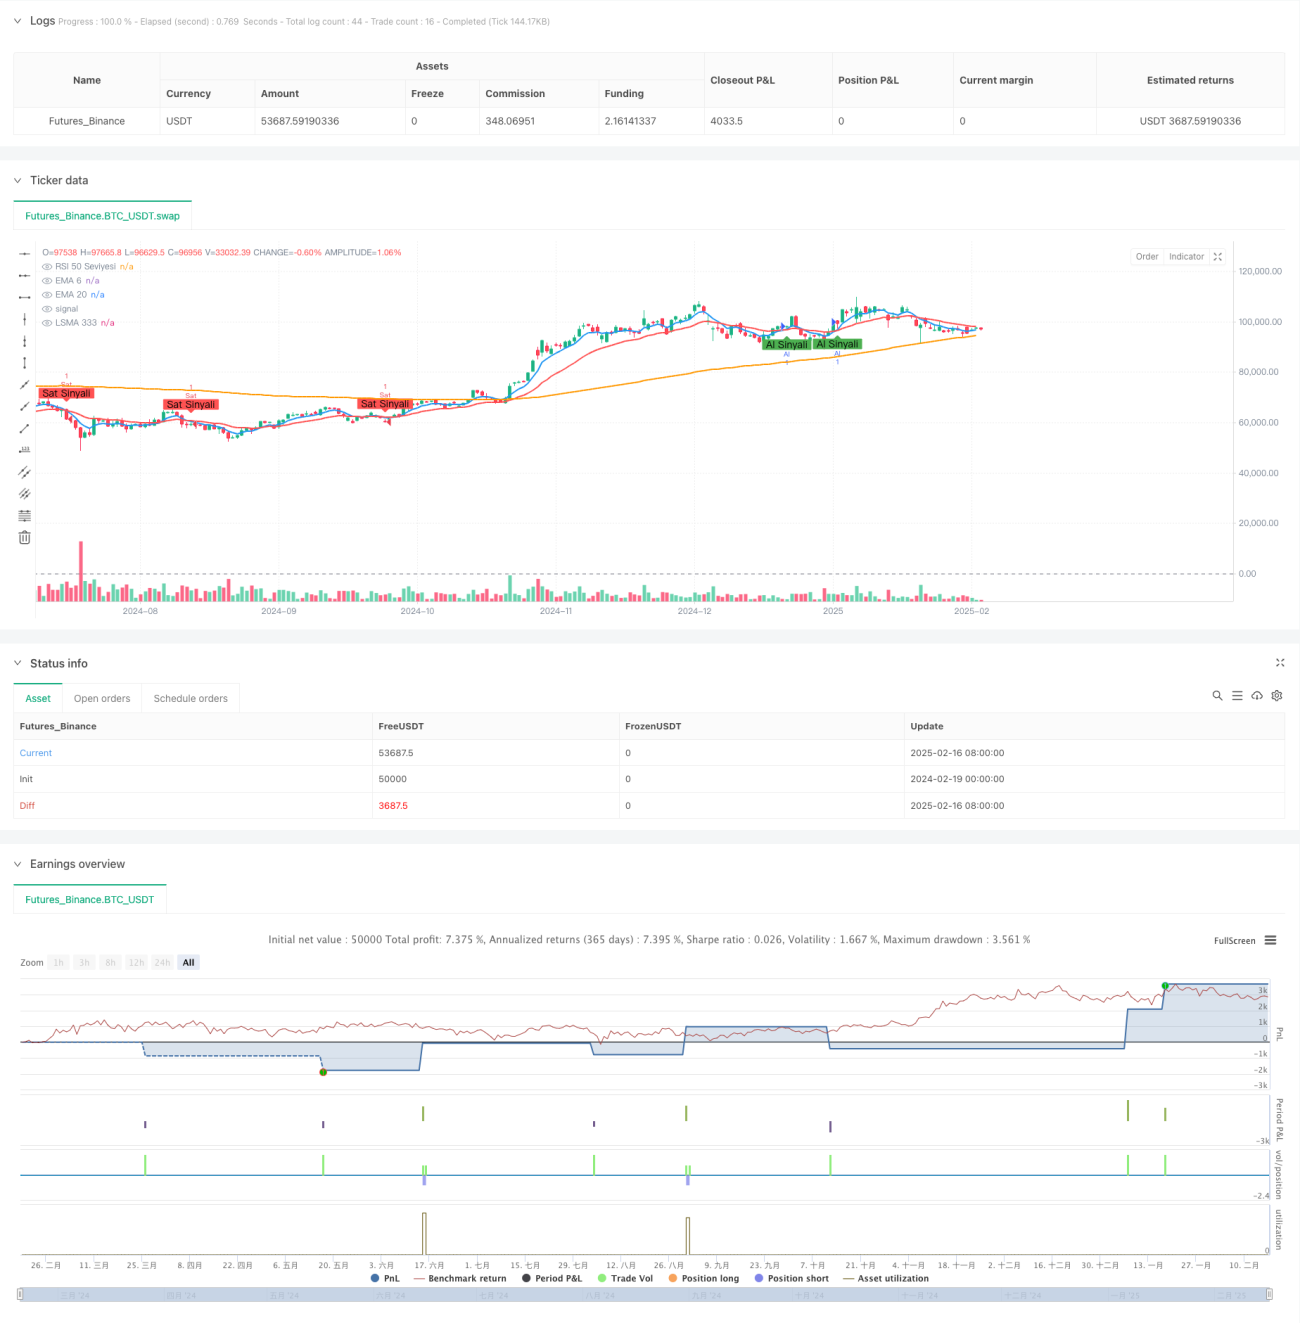
이 전략은 EMA (지수 이동 평균), LSMA (최소 2배 이동 평균) 및 RSI (상대적으로 약한 지표) 의 세 가지 지표를 결합하여 여러 신호를 확인하여 거래 기회를 필터링하는 다중 기술 지표의 교차에 기반한 트렌드 추적 시스템입니다. 전략은 시장의 역동성에 따라 위험 관리 매개 변수를 조정할 수 있는 적응형 스톱 손실 메커니즘을 사용합니다.
이 전략의 핵심 논리는 다음과 같습니다.
이 전략은 여러 기술적 지표의 조합을 통해 비교적 안정적인 트렌드 추적 시스템을 구축한다. 전략의 핵심 장점은 신호 확인의 신뢰성이다. 그러나 동시에 다양한 시장 환경에서의 적응성에 주의를 기울여야 한다. 지속적인 최적화 및 개선으로 전략은 실제 거래에서 더 나은 성능을 얻을 수 있다.
/*backtest
start: 2024-02-19 00:00:00
end: 2025-02-17 00:00:00
period: 1d
basePeriod: 1d
exchanges: [{"eid":"Futures_Binance","currency":"BTC_USDT"}]
*/
//@version=6
strategy("EMA 6-20 + LSMA 333 + RSI 50 Filtreli Al-Sat Stratejisi", overlay=true)
// Parametreler
emaShortLength = input.int(6, title="Kısa EMA Uzunluğu", minval=1)
emaLongLength = input.int(20, title="Uzun EMA Uzunluğu", minval=1)
lsmaLength = input.int(333, title="LSMA Uzunluğu", minval=1)
rsiLength = input.int(14, title="RSI Uzunluğu", minval=1)
stopLossPerc = input.float(1.0, title="Stop Loss Yüzdesi", minval=0.1)
takeProfitPerc = input.float(2.0, title="Take Profit Yüzdesi", minval=0.1)
// EMA Hesaplamaları
emaShort = ta.ema(close, emaShortLength)
emaLong = ta.ema(close, emaLongLength)
// LSMA Hesaplaması
lsma = ta.linreg(close, lsmaLength, 0)
// RSI Hesaplaması
rsi = ta.rsi(close, rsiLength)
// EMA Kesişimleri
emaCrossUp = ta.crossover(emaShort, emaLong) // EMA 6, EMA 20'nin üzerine çıkarsa
emaCrossDown = ta.crossunder(emaShort, emaLong) // EMA 6, EMA 20'nin altına inerse
// LSMA Filtresi
lsmaFilterBuy = close > lsma // Fiyat LSMA 333'ün üzerinde mi?
lsmaFilterSell = close < lsma // Fiyat LSMA 333'ün altında mı?
// RSI Filtresi
rsiFilterBuy = rsi > 50 // RSI 50'nin üzerinde mi?
rsiFilterSell = rsi < 50 // RSI 50'nin altında mı?
// Alım ve Satım Koşulları
if (emaCrossUp and lsmaFilterBuy and rsiFilterBuy) // EMA 6, EMA 20'nin üzerine çıkarsa VE fiyat LSMA 333'ün üzerindeyse VE RSI 50'nin üzerindeyse
strategy.entry("Al", strategy.long)
strategy.exit("Take Profit/Stop Loss", "Al", stop=close * (1 - stopLossPerc / 100), limit=close * (1 + takeProfitPerc / 100))
if (emaCrossDown and lsmaFilterSell and rsiFilterSell) // EMA 6, EMA 20'nin altına inerse VE fiyat LSMA 333'ün altındaysa VE RSI 50'nin altındaysa
strategy.entry("Sat", strategy.short)
strategy.exit("Take Profit/Stop Loss", "Sat", stop=close * (1 + stopLossPerc / 100), limit=close * (1 - takeProfitPerc / 100))
// EMA, LSMA ve RSI Çizgileri
plot(emaShort, color=color.blue, title="EMA 6", linewidth=2)
plot(emaLong, color=color.red, title="EMA 20", linewidth=2)
plot(lsma, color=color.orange, title="LSMA 333", linewidth=2)
hline(50, "RSI 50 Seviyesi", color=color.gray)
// Kesişim İşaretleri
plotshape(series=emaCrossUp and lsmaFilterBuy and rsiFilterBuy, location=location.belowbar, color=color.green, style=shape.labelup, text="Al Sinyali")
plotshape(series=emaCrossDown and lsmaFilterSell and rsiFilterSell, location=location.abovebar, color=color.red, style=shape.labeldown, text="Sat Sinyali")