다중 기간 이동 평균 추세 판단 및 RSI 과매수 전략

1
Follow
1781
Followers
개요
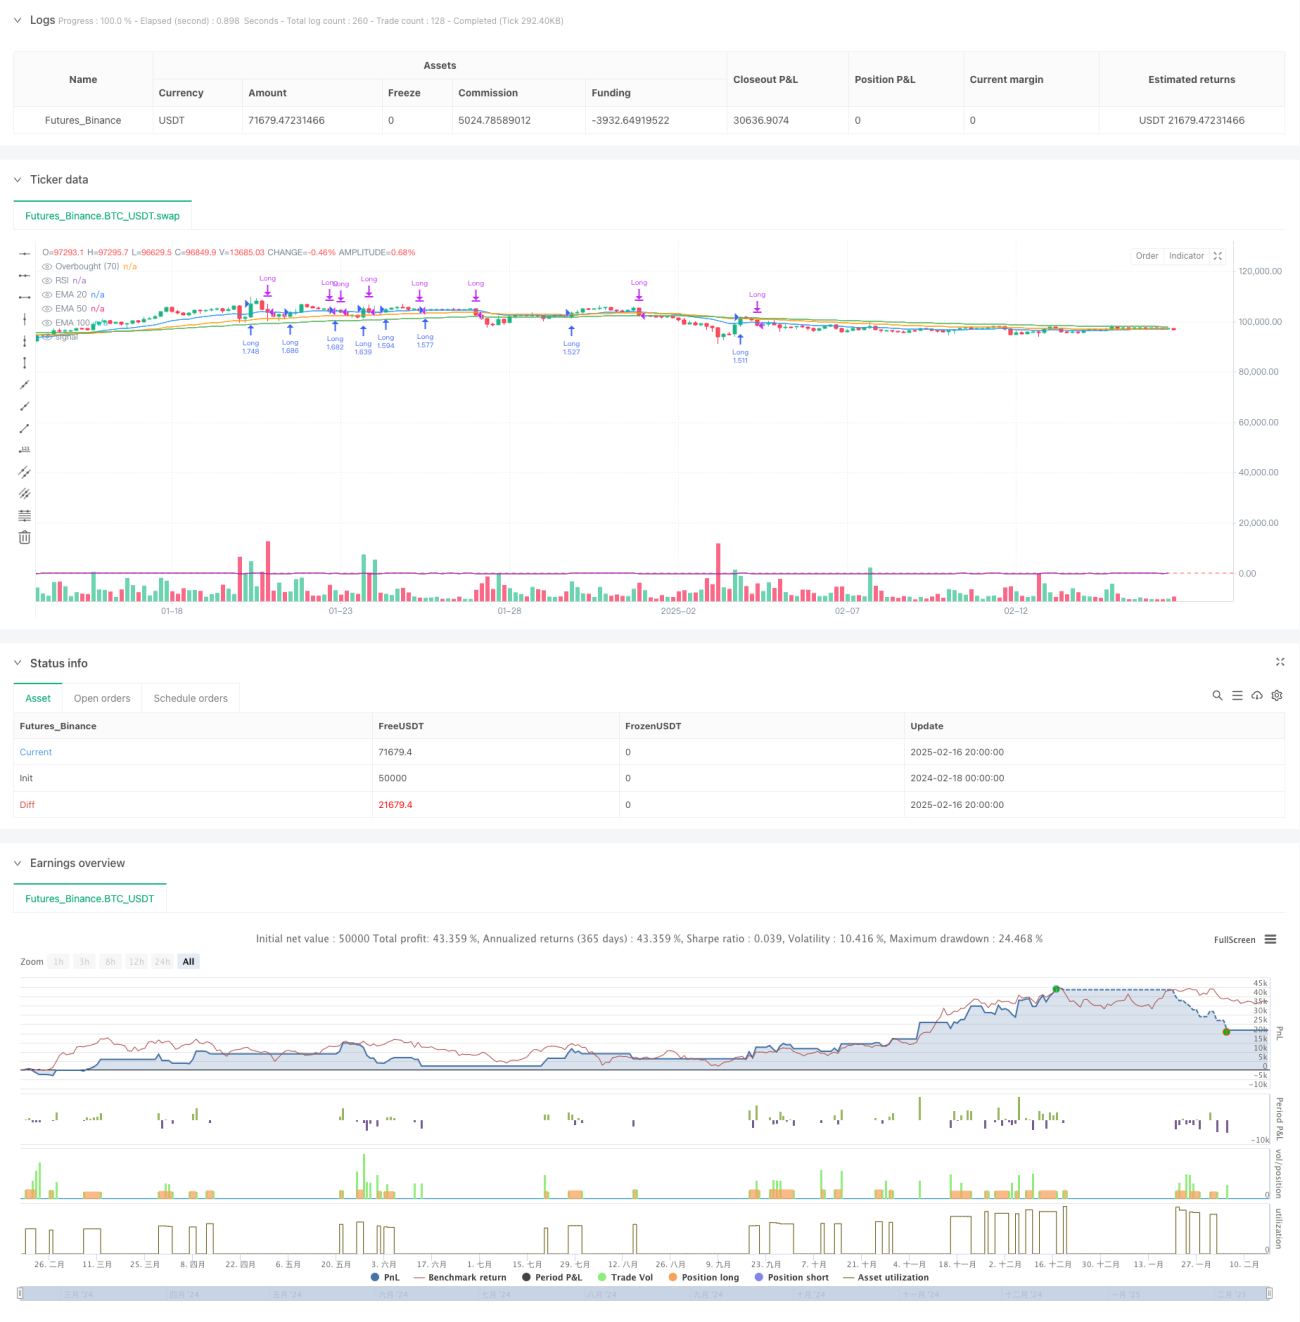
이 전략은 다주기 지수 이동 평균 ((EMA) 와 상대적으로 강한 지표 ((RSI) 를 기반으로 한 트렌드 추적 거래 시스템이다. 이 전략은 20, 50, 100의 3주기 EMA 트렌드를 판단하여 가격 돌파와 RSI 오버 바이 신호를 결합하여 거래 결정을 내린다. 이 전략은 주로 트렌딩 시장에 적용되며, 다중 기술 지표의 검증을 통해 거래의 정확성을 높인다.
전략 원칙
전략의 핵심 논리는 다음과 같은 핵심 부분으로 구성됩니다.
- 추세 판단: 현재의 EMA와 전기의 EMA를 비교하여 3주기 ((20/50/100) 의 평균이 상승 추세에 있는지 판단합니다.
- 진입 조건: 가격이 아래에서 20주기 EMA를 돌파하고 3개의 평행선이 모두 상승 추세에 있을 때 구매 신호를 발산한다
- 출구 조건: RSI가 70을 초과하거나 20주기 EMA를 넘어가는 경우 평점
- 포지션 관리: 계정 총액의 % (~10%) 을 사용하여 포지션을 보유
전략적 이점
- 복수 확인 메커니즘: 3개의 다른 주기의 EMA와 RSI 지표를 통해 상호 검증하여 가짜 돌파의 위험을 줄입니다.
- 트렌드 추적: 중·장기 트렌드를 효과적으로 파악하여 수익성을 높여줍니다.
- 리스크 제어: RSI 오버 바이 신호와 평균선 하락을 스톱 조건으로 사용하여 회수를 효과적으로 제어
- 자금 관리: 백분율 포지션 관리로, 계좌 크기에 따라 거래량을 자동으로 조정할 수 있습니다.
- 체계화 된 운영: 전략 규칙이 명확하여 주관적 판단의 방해를 줄일 수 있습니다.
전략적 위험
- 지연성: EMA가 지연된 지표로서 입출금 시기가 약간 늦어질 수 있다.
- 변동 시장의 위험: 변동 시장에서 빈번한 잘못된 신호가 발생할 수 있습니다.
- 폭락 위험: 시장의 급격한 폭락으로 인해 스톱포트가 무효화될 수 있다.
- 매개 변수 민감성: 다른 시장 환경에서 EMA 주기와 RSI 마이너스를 조정할 수 있습니다.
- 거래 비용: 거래 빈도가 높은 거래 비용이 발생할 수 있습니다
전략 최적화 방향
- 시장 환경 인식: 시장 상태를 판단하는 메커니즘을 추가하여 불안정한 시장에서 자동으로 위치를 낮추거나 거래를 중지합니다.
- 동적 변수 최적화: 시장의 변동에 따라 자동으로 EMA 주기와 RSI 하락값을 조정합니다.
- 스톱로스 최적화: 추적 스톱로스 메커니즘을 도입하여 수익을 더 잘 보호
- 입구 최적화: 거래량 확인 메커니즘을 늘리고, 돌파 신호의 신뢰성을 높인다.
- 포지션 관리 최적화: 트렌드 강도 및 시장 변동률에 따라 포지션 비율을 동적으로 조정합니다.
요약하다
이것은 트렌드 추적과 동력 반전을 결합한 복합 전략 시스템이다. 여러 가지 기술 지표의 조합 사용으로 전략이 간단하고 이해하기 쉽게 유지되는 동시에 더 나은 위험 수익 특성을 달성한다. 전략의 핵심 장점은 엄격한 트렌드 확인 장치와 완벽한 위험 제어 시스템이지만 실제 응용에서는 매개 변수 최적화 및 시장 환경에 대한 적합성에 주의를 기울여야 한다. 제안된 최적화 방향에 따라 전략에는 더 많은 개선의 여지가 있다.
Source
Pine
/*backtest
start: 2024-02-18 00:00:00
end: 2025-02-17 00:00:00
period: 4h
basePeriod: 4h
exchanges: [{"eid":"Futures_Binance","currency":"BTC_USDT"}]
*/

//@version=5
strategy("EMA Crossover + RSI Strategy", overlay=true, initial_capital=10000, default_qty_type=strategy.percent_of_equity, default_qty_value=200)

// Calculate EMAsRelated strategies
Comment
All comments (0)
No data
- 1