
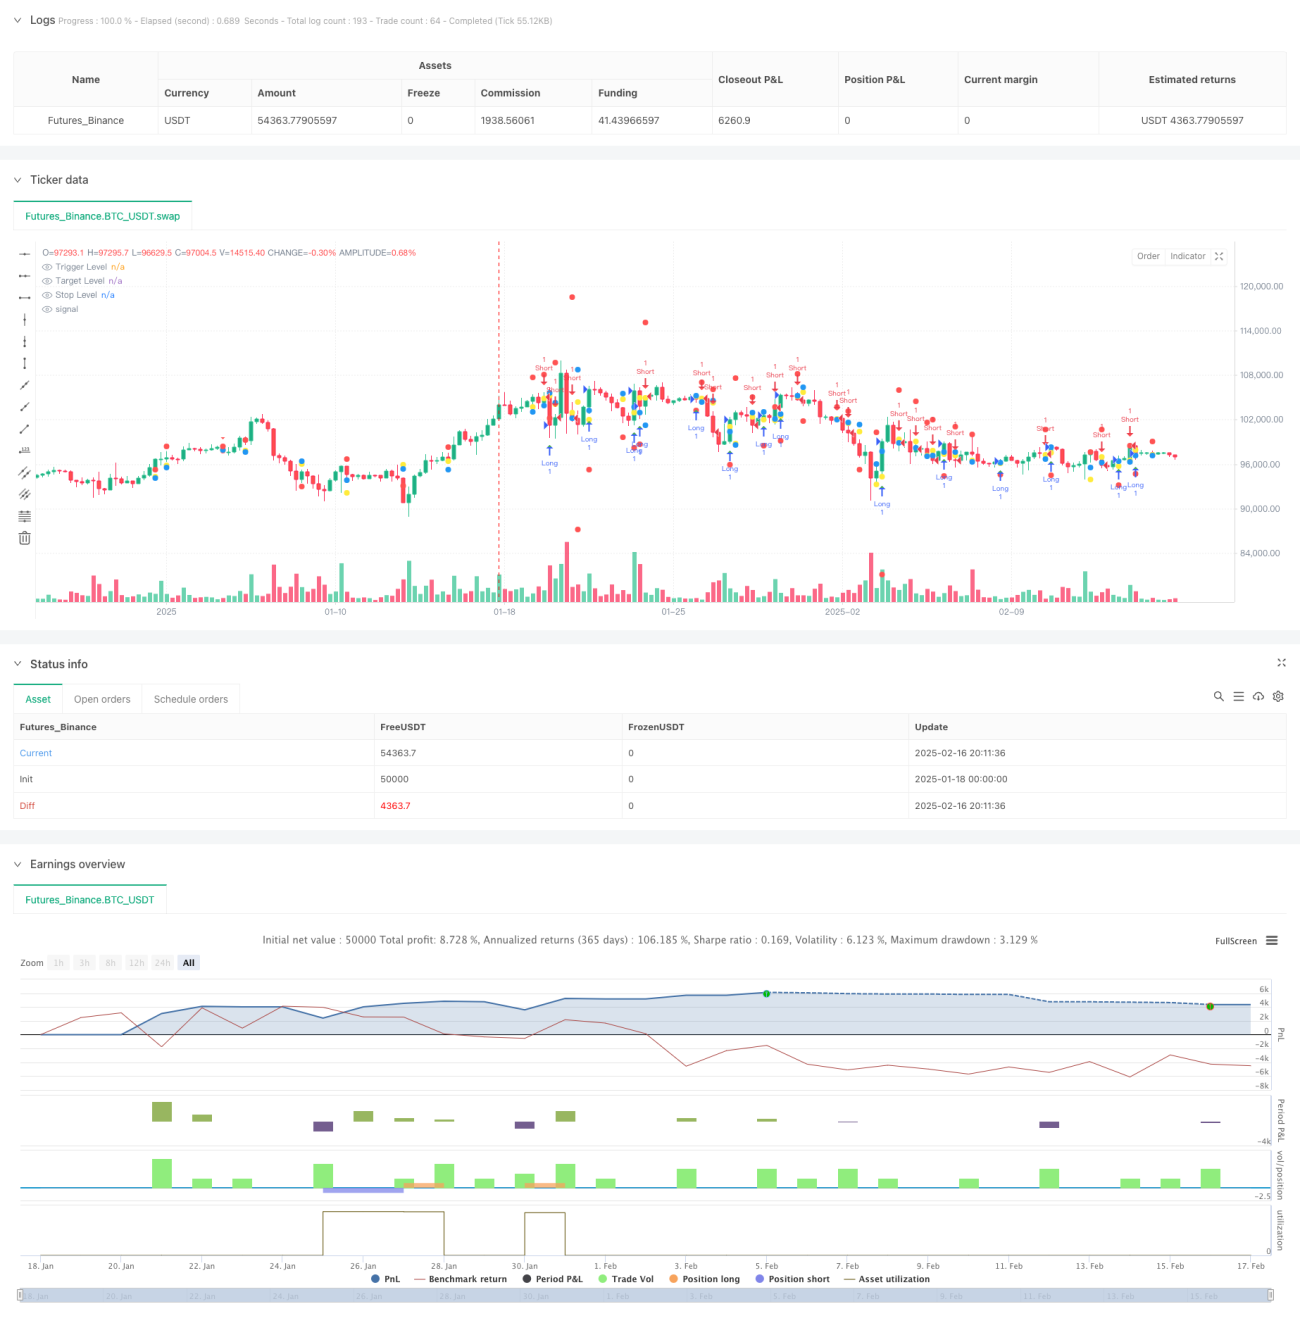
이것은 그래프 간격 이론에 기반한 다중 시간 주기의 거래 전략이다. 이 전략은 주로 더 높은 시간 주기의 그래프 형태와 가격 간격을 분석하여 잠재적인 거래 기회를 식별한다. 이 전략은 거래량 필터와 동적 스톱 패스 메커니즘을 통합하여 이전 시기의 높은 낮은 시점에 대한 돌파구를 통해 트렌디션 기회를 포착한다.
전략의 핵심은 더 높은 시간 주기 (설정된 4시간) 에서 가격이 이전 범위를 돌파하는 상황을 모니터링하는 것입니다. 구체적으로:
이것은 구조적이고, 논리적으로 명확한 다중 시간 주기의 거래 전략이다. 위험 관리와 필터링 메커니즘을 통합하면서 더 높은 시간 주기의 가격 행동을 분석하여 잠재적인 트렌딩 기회를 찾는다. 전략의 핵심 장점은 다양한 시장 환경에 적응할 수 있는 간단한 매개 변수 조정으로 적응할 수 있는 적응성과 확장성이다.
/*backtest
start: 2025-01-18 00:00:00
end: 2025-02-17 00:00:00
period: 6h
basePeriod: 6h
exchanges: [{"eid":"Futures_Binance","currency":"BTC_USDT"}]
*/
//@version=6
strategy("Candle Range Theory Strategy", overlay=true)
// Input parameters
var string HTF = input.timeframe("240", "Higher Timeframe (Minutes)") // 4H default
var float stopLossMultiplier = input.float(1.5, "Stop Loss Multiplier", minval=0.5)
var bool useVolFilter = input.bool(false, "Use Volume Filter")
var float volThreshold = input.float(1.5, "Volume Threshold Multiplier", minval=1.0)
// Function to get higher timeframe data
getHtfData(src) =>
request.security(syminfo.tickerid, HTF, src)
// Calculate volume condition once per bar
var bool volCondition = true
if useVolFilter
float vol = getHtfData(volume)
float avgVol = ta.sma(vol, 20)
volCondition := vol > avgVol * volThreshold
// Get HTF candle data
htf_open = getHtfData(open)
htf_high = getHtfData(high)
htf_low = getHtfData(low)
htf_close = getHtfData(close)
// Store previous candle data
var float h1 = na // High of Candle 1
var float l1 = na // Low of Candle 1
var float h2 = na // High of Candle 2
var float l2 = na // Low of Candle 2
var float prevClose = na
// Track setup conditions
var string setupType = na
var float triggerLevel = na
var float targetLevel = na
var float stopLevel = na
// Update candle data - fixed time function usage
var bool isNewBar = false
isNewBar := ta.change(request.security(syminfo.tickerid, HTF, time)) != 0
if isNewBar
h1 := h2
l1 := l2
h2 := htf_high[1]
l2 := htf_low[1]
prevClose := htf_close[1]
// Identify setup conditions
if not na(h1) and not na(h2) and not na(prevClose)
if (h2 > h1 and prevClose < h1) // Short setup
setupType := "short"
triggerLevel := l2
targetLevel := l1
stopLevel := h2 + (h2 - l1) * stopLossMultiplier
else if (l2 < l1 and prevClose > l1) // Long setup
setupType := "long"
triggerLevel := h2
targetLevel := h1
stopLevel := l2 - (h1 - l2) * stopLossMultiplier
else
setupType := na
triggerLevel := na
targetLevel := na
stopLevel := na
// Entry conditions using pre-calculated volume condition - fixed line breaks
bool longCondition = setupType == "long" and high > triggerLevel and not na(triggerLevel) and volCondition
bool shortCondition = setupType == "short" and low < triggerLevel and not na(triggerLevel) and volCondition
// Execute trades
if longCondition
strategy.entry("Long", strategy.long, comment="Long Entry")
strategy.exit("Long Exit", "Long", limit=targetLevel, stop=stopLevel)
if shortCondition
strategy.entry("Short", strategy.short, comment="Short Entry")
strategy.exit("Short Exit", "Short", limit=targetLevel, stop=stopLevel)
// Plot signals - fixed plotshape parameters
plotshape(series=longCondition, title="Long Signal", location=location.belowbar, color=color.green, style=shape.triangleup)
plotshape(series=shortCondition, title="Short Signal", location=location.abovebar, color=color.red, style=shape.triangledown)
plot(triggerLevel, "Trigger Level", color=color.yellow, style=plot.style_circles)
plot(targetLevel, "Target Level", color=color.blue, style=plot.style_circles)
plot(stopLevel, "Stop Level", color=color.red, style=plot.style_circles)