동적 볼륨 이동 평균 추세 추종 및 HLCC4 돌파 거래 전략

1
Follow
1781
Followers
개요
이 전략은 다중 시간 주기를 기반으로 한 트렌드 추적 시스템으로, 주기 50주기 트랜스포메이션 중화 이동 평균 ((VWMA) 을 대 트렌드 필터로 결합하고, 현재 시간 주기의 200주기 VWMA 및 HLCC4 가격 돌파구를 구체적인 거래 신호로 사용합니다. 이것은 엄격한 트렌드 확인과 다중 시간 주기의 검증을 통해 거래의 신뢰성을 높이기 위해 더 많은 일을하는 전략입니다.
전략 원칙
이 전략의 핵심 논리는 다음과 같은 핵심 요소들을 포함하고 있습니다.
- 주주 50주기 VWMA를 대동향 판단기준으로 사용하여, 가격이 이 평균선 위에 있을 때만 포지션을 열 수 있다.
- 입시 조건은 두 개의 연속적인 K 선의 종결값이 200주기 VWMA 위에 있고, 두 번째 K 선의 종결값이 첫 번째 K 선의 HLCC4 평균값보다 높아야 한다는 것을 충족해야 한다.
- 출구 신호는 일선 레벨에 기반하며, 일선 200주기 VWMA 아래로 하루 일선 종결 가격이 떨어질 때 평지한다.
- 전략은 고정 포지션 관리 방식을 채택하고, 매 거래마다 계정 권익의 10%를 사용한다.
- 최근 5년 동안의 주간 기간을 재검토하여 전략이 근래 시장 환경에서의 효과를 보장한다.
전략적 이점
- 다중 시간 주기 검증: 주경선과 해경선의 조합을 통해 큰 추세를 파악하고 시장 변화에 신속하게 대응할 수 있다.
- 리스크 관리가 개선되었다: VWMA를 간단한 이동 평균 대신 사용하여 시장의 실제 움직임을 더 잘 반영할 수 있다.
- 트렌드 확인이 엄격하다: 복수의 조건이 동시에 충족되어야 입학이 가능하며, 가짜 침입의 위험이 낮아진다.
- 포지션 관리 합리적인: 고정 비율의 포지션 관리 방식은 위험을 통제하고 수익 공간을 유지합니다.
- 자동화 수준: 전략이 명확하고 거래가 완전히 자동화 될 수 있습니다.
전략적 위험
- 추세 역전 위험: 시장의 격렬한 변동으로 인해 큰 회전이 발생할 수 있습니다.
- 슬라이드 포인트 효과: 시장 유동성이 부족할 때 실제 거래 가격이 이론 가격과 편차할 수 있다.
- 신호 지연: 더 긴 기간의 평균선을 사용하기 때문에, 전략이 트렌드 전환점에서의 반응이 상대적으로 지연될 수 있다.
- 허위 침입 위험: 여러 번 확인되었지만 허위 침입으로 인한 손실이 발생할 수 있습니다.
- 한방 거래 제한: 전략이 너무 많아서 하향 추세에서 잠재적인 하락 기회를 놓치게 됩니다.
전략 최적화 방향
- 동적 변수 최적화: 시장의 변동에 따라 VWMA의 주기적 변수를 자동으로 조정할 수 있다.
- 포지션 관리 최적화: 변동율에 기반한 동적 포지션 관리 시스템을 도입한다.
- 출전 메커니즘 개선: 이동 상쇄 또는 기술 지표에 기반한 동적 상쇄를 추가할 수 있다.
- 시장 정서 지표: RSI 또는 MACD와 같은 지표와 결합하여 신호의 신뢰성을 높인다.
- 거래량 분석을 도입: 거래량 분석을 심화하고 VWMA의 계산 방법을 최적화한다.
요약하다
이 전략의 핵심 장점은 트렌드 확인 메커니즘과 명확한 거래 논리입니다. 강력한 시장에서 중·장기 트렌드 기회를 잡기 위해 적합합니다. 제안된 최적화 방향을 통해 전략은 더 향상시킬 여지가 있습니다.
Source
Pine
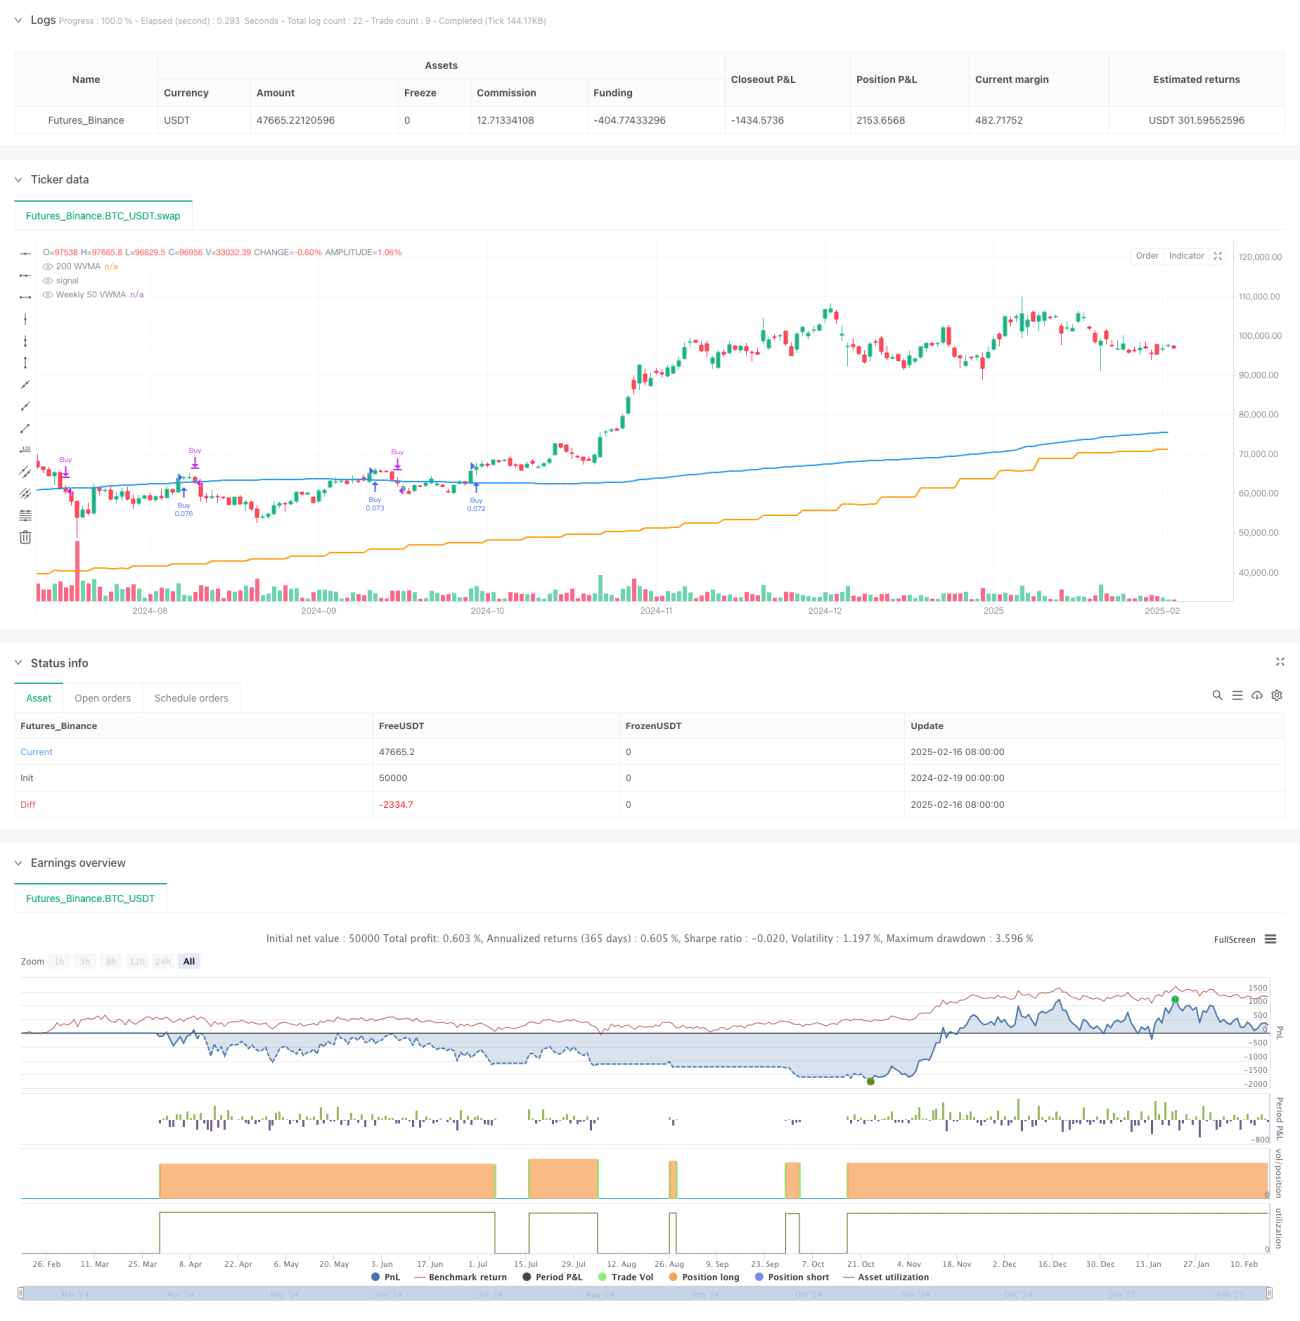
/*backtest
start: 2024-02-19 00:00:00
end: 2025-02-17 00:00:00
period: 1d
basePeriod: 1d
exchanges: [{"eid":"Futures_Binance","currency":"BTC_USDT"}]
*/

//@version=6
strategy("Long-Only 200 WVMA + HLCC4 Strategy (Weekly 50 VWMA Filter, Daily Exit, Last 5 Years)", overlay=true, default_qty_type=strategy.percent_of_equity, default_qty_value=10)

// ParametersStrategy parameters
Related strategies
Comment
All comments (0)
No data
- 1