하이브리드 피보나치 모멘텀 이동 평균 교차 전략

MA SMA TP SL FIBONACCI
생성 날짜: 2025-02-19 11:02:16 마지막으로 수정됨: 2025-02-19 11:02:16
복사: 3 클릭수: 479
avatar of ChaoZhang ChaoZhang
1
집중하다
1617
수행원

하이브리드 피보나치 모멘텀 이동 평균 교차 전략

개요

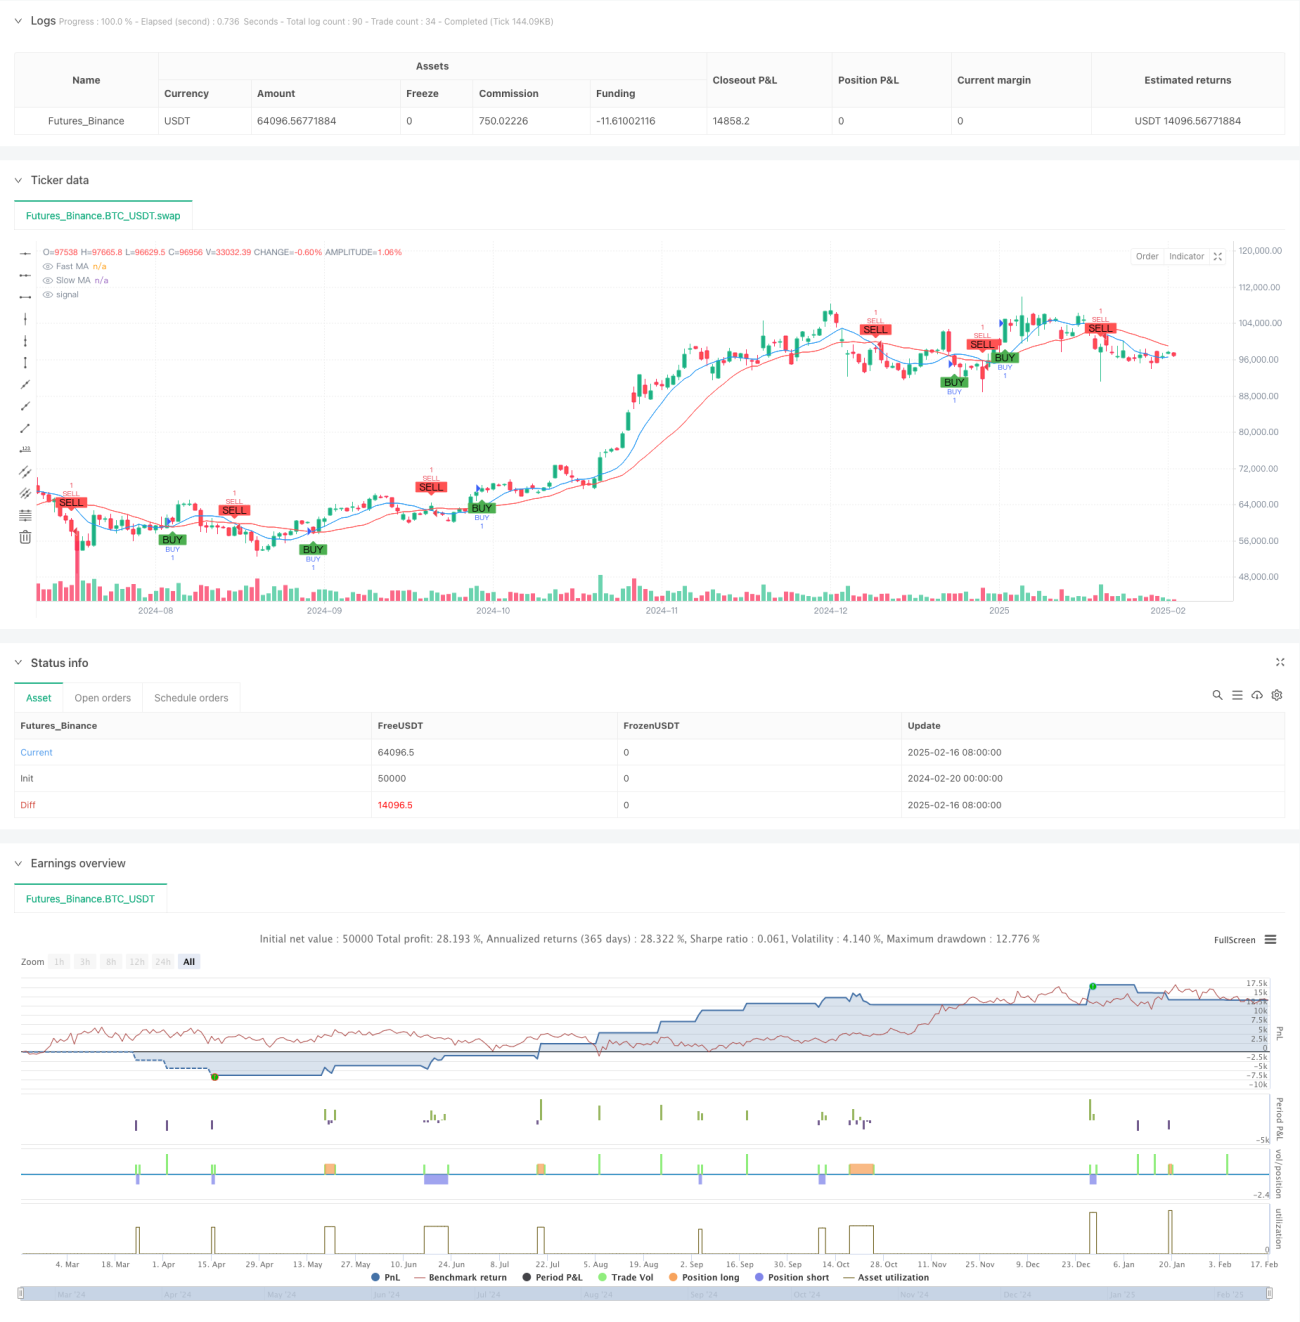
이 전략은 피포나치 리트랙트 레벨, 이동평균선 교차, 그리고 동력 트렌드 판단을 결합한 통합 거래 시스템이다. 그것은 빠른 이동평균선과 느린 이동평균선의 교차를 통해 거래 신호를 생성하며, 피포나치 리트랙트 레벨을 중요한 가격 기준점으로 사용하며, 트렌드 판단을 결합하여 거래 시기를 최적화한다. 시스템은 또한 위험 관리를 구현하기 위해 백분율 중지 및 중지 설정을 통합한다.

전략 원칙

전략의 핵심 논리는 다음과 같은 핵심 요소에 기초합니다.

  1. 이동 평균선 교차 시스템은 9일과 21일 간단한 이동 평균선 ((SMA) 을 신호 지표로 사용합니다.
  2. 100주기 동안 계산된 피보나치 회귀 수준 (%23.6%, 38.2%, 50%, 61.8%) 은 시장 구조 분석에 사용됩니다.
  3. 가격과 급속한 평균선의 위치 관계를 통해 시장의 추세를 판단하는 방법
  4. 창고 건설 신호는 빠른 평균선 상의 느린 평균선 ((多做) 또는 낮은 느린 평균선 ((空做) 을 통과하여 촉발된다.
  5. 시스템 자동으로 입점 가격에 따라 Stop Loss 및 Stop Loss의 비율을 설정합니다.

전략적 이점

  1. 다차원 분석: 기술 분석에서 가장 인정받는 3가지 요소를 결합한 분석 (트렌드, 동력, 가격 수준)
  2. 리스크 관리가 잘 되어 있습니다. 미리 설정된 스톱 스 비율을 사용하여 자금을 안전하게 보호합니다.
  3. 높은 가시성: 모든 중요한 가격 수준과 거래 신호를 차트에 명확하게 표시
  4. 적응력: 다양한 시장 환경에 따라 변수를 조정할 수 있습니다.
  5. 작동 규칙이 명확하다: 신호 생성 조건이 명확하다, 주관적인 판단을 피한다.

전략적 위험

  1. 이동평선 시스템은 흔들리는 시장에서 잘못된 신호를 생성할 수 있다.
  2. 고정 비율의 스톱 로즈 설정은 모든 시장 환경에 적합하지 않을 수 있습니다.
  3. 가격 변동성이 높은 시장에서 금속적으로 스톱로스를 돌파할 수 있습니다.
  4. 피보나치 레벨의 유효성은 시장 조건의 변화에 따라 변할 수 있습니다.
  5. 추세 판단은 시장 전환점에 지연될 수 있습니다.

전략 최적화 방향

  1. 변동률 지표를 도입하여 스톱 스톱 비율을 동적으로 조정합니다.
  2. 거래 신호를 확인하기 위해 거래량 분석을 추가합니다.
  3. 신호 신뢰성을 높이기 위해 다른 시간 주기의 확인을 고려하십시오.
  4. 시장 환경 필터링 조건에 가입하여 적절한 시장 조건에서 거래합니다.
  5. 자율적인 변수 최적화 시스템 개발

요약하다

이것은 여러 클래식 기술 분석 도구를 결합 한 포괄적 인 거래 전략입니다. 이동 평균, 피보나치 회수 및 트렌드 분석을 결합하여 전략은 시장에서 잠재적인 거래 기회를 잡을 수 있습니다. 또한, 완벽한 위험 관리 시스템과 명확한 시각적 인터페이스는 훌륭한 실용성을 제공합니다. 일부 고유한 위험이 있지만, 지속적인 최적화 및 개선으로 전략은 실제 거래에서 더 나은 성능을 기대합니다.

전략 소스 코드
/*backtest
start: 2024-02-20 00:00:00
end: 2025-02-17 08:00:00
period: 1d
basePeriod: 1d
exchanges: [{"eid":"Futures_Binance","currency":"BTC_USDT"}]
*/

//@version=5
strategy("Buy/Sell Strategy with TP, SL, Fibonacci Levels, and Trend", overlay=true)

// Input for stop loss and take profit percentages
stopLossPercentage = input.int(2, title="Stop Loss (%)") // Stop loss percentage
takeProfitPercentage = input.int(4, title="Take Profit (%)") // Take profit percentage

// Example of a moving average crossover strategy
fastLength = input.int(9, title="Fast MA Length")
slowLength = input.int(21, title="Slow MA Length")

fastMA = ta.sma(close, fastLength)
slowMA = ta.sma(close, slowLength)

// Entry conditions (Buy when fast MA crosses above slow MA, Sell when fast MA crosses below slow MA)
longCondition = ta.crossover(fastMA, slowMA)
shortCondition = ta.crossunder(fastMA, slowMA)

// Plot moving averages for visual reference
plot(fastMA, color=color.blue, title="Fast MA")
plot(slowMA, color=color.red, title="Slow MA")

// Fibonacci Retracement Levels
lookback = input.int(100, title="Lookback Period for Fibonacci Levels")
highLevel = ta.highest(high, lookback)
lowLevel = ta.lowest(low, lookback)

fib236 = lowLevel + (highLevel - lowLevel) * 0.236
fib382 = lowLevel + (highLevel - lowLevel) * 0.382
fib50 = lowLevel + (highLevel - lowLevel) * 0.5
fib618 = lowLevel + (highLevel - lowLevel) * 0.618

// Display Fibonacci levels as text on the chart near price panel (left of candle)
label.new(bar_index, fib236, text="Fib 23.6%: " + str.tostring(fib236, "#.##"), style=label.style_label_left, color=color.purple, textcolor=color.white, size=size.small, xloc=xloc.bar_index, yloc=yloc.price)
label.new(bar_index, fib382, text="Fib 38.2%: " + str.tostring(fib382, "#.##"), style=label.style_label_left, color=color.blue, textcolor=color.white, size=size.small, xloc=xloc.bar_index, yloc=yloc.price)
label.new(bar_index, fib50, text="Fib 50%: " + str.tostring(fib50, "#.##"), style=label.style_label_left, color=color.green, textcolor=color.white, size=size.small, xloc=xloc.bar_index, yloc=yloc.price)
label.new(bar_index, fib618, text="Fib 61.8%: " + str.tostring(fib618, "#.##"), style=label.style_label_left, color=color.red, textcolor=color.white, size=size.small, xloc=xloc.bar_index, yloc=yloc.price)

// Trend condition: Price uptrend or downtrend
trendCondition = close > fastMA ? "Uptrending" : close < fastMA ? "Downtrending" : "Neutral"

// Remove previous trend label and add new trend label
var label trendLabel = na
if (not na(trendLabel))
    label.delete(trendLabel)

// Create a new trend label based on the current trend
trendLabel := label.new(bar_index, close, text="Trend: " + trendCondition, style=label.style_label_left, color=color.blue, textcolor=color.white, size=size.small, xloc=xloc.bar_index, yloc=yloc.price)

// Buy and Sell orders with Stop Loss and Take Profit
if (longCondition)
    // Set the Stop Loss and Take Profit levels based on entry price
    stopLossLevel = close * (1 - stopLossPercentage / 100)
    takeProfitLevel = close * (1 + takeProfitPercentage / 100)
    // Enter long position with stop loss and take profit levels
    strategy.entry("BUY", strategy.long)
    strategy.exit("Sell", "BUY", stop=stopLossLevel, limit=takeProfitLevel)
    
    // Display TP, SL, and Entry price labels on the chart near price panel (left of candle)
    label.new(bar_index, takeProfitLevel, text="TP\n" + str.tostring(takeProfitLevel, "#.##"), style=label.style_label_left, color=color.green, textcolor=color.white, size=size.small, xloc=xloc.bar_index, yloc=yloc.price)
    label.new(bar_index, stopLossLevel, text="SL\n" + str.tostring(stopLossLevel, "#.##"), style=label.style_label_left, color=color.red, textcolor=color.white, size=size.small, xloc=xloc.bar_index, yloc=yloc.price)
    label.new(bar_index, close, text="BUY\n" + str.tostring(close, "#.##"), style=label.style_label_left, color=color.blue, textcolor=color.white, size=size.small, xloc=xloc.bar_index, yloc=yloc.price)

if (shortCondition)
    // Set the Stop Loss and Take Profit levels based on entry price
    stopLossLevel = close * (1 + stopLossPercentage / 100)
    takeProfitLevel = close * (1 - takeProfitPercentage / 100)
    // Enter short position with stop loss and take profit levels
    strategy.entry("SELL", strategy.short)
    strategy.exit("Cover", "SELL", stop=stopLossLevel, limit=takeProfitLevel)
    
    // Display TP, SL, and Entry price labels on the chart near price panel (left of candle)
    label.new(bar_index, takeProfitLevel, text="TP\n" + str.tostring(takeProfitLevel, "#.##"), style=label.style_label_left, color=color.green, textcolor=color.white, size=size.small, xloc=xloc.bar_index, yloc=yloc.price)
    label.new(bar_index, stopLossLevel, text="SL\n" + str.tostring(stopLossLevel, "#.##"), style=label.style_label_left, color=color.red, textcolor=color.white, size=size.small, xloc=xloc.bar_index, yloc=yloc.price)
    label.new(bar_index, close, text="SELL\n" + str.tostring(close, "#.##"), style=label.style_label_left, color=color.orange, textcolor=color.white, size=size.small, xloc=xloc.bar_index, yloc=yloc.price)

// Plot Buy/Sell labels on chart
plotshape(series=longCondition, title="BUY Signal", location=location.belowbar, color=color.green, style=shape.labelup, text="BUY")
plotshape(series=shortCondition, title="SELL Signal", location=location.abovebar, color=color.red, style=shape.labeldown, text="SELL")