
1
Follow
1781
Followers
개요
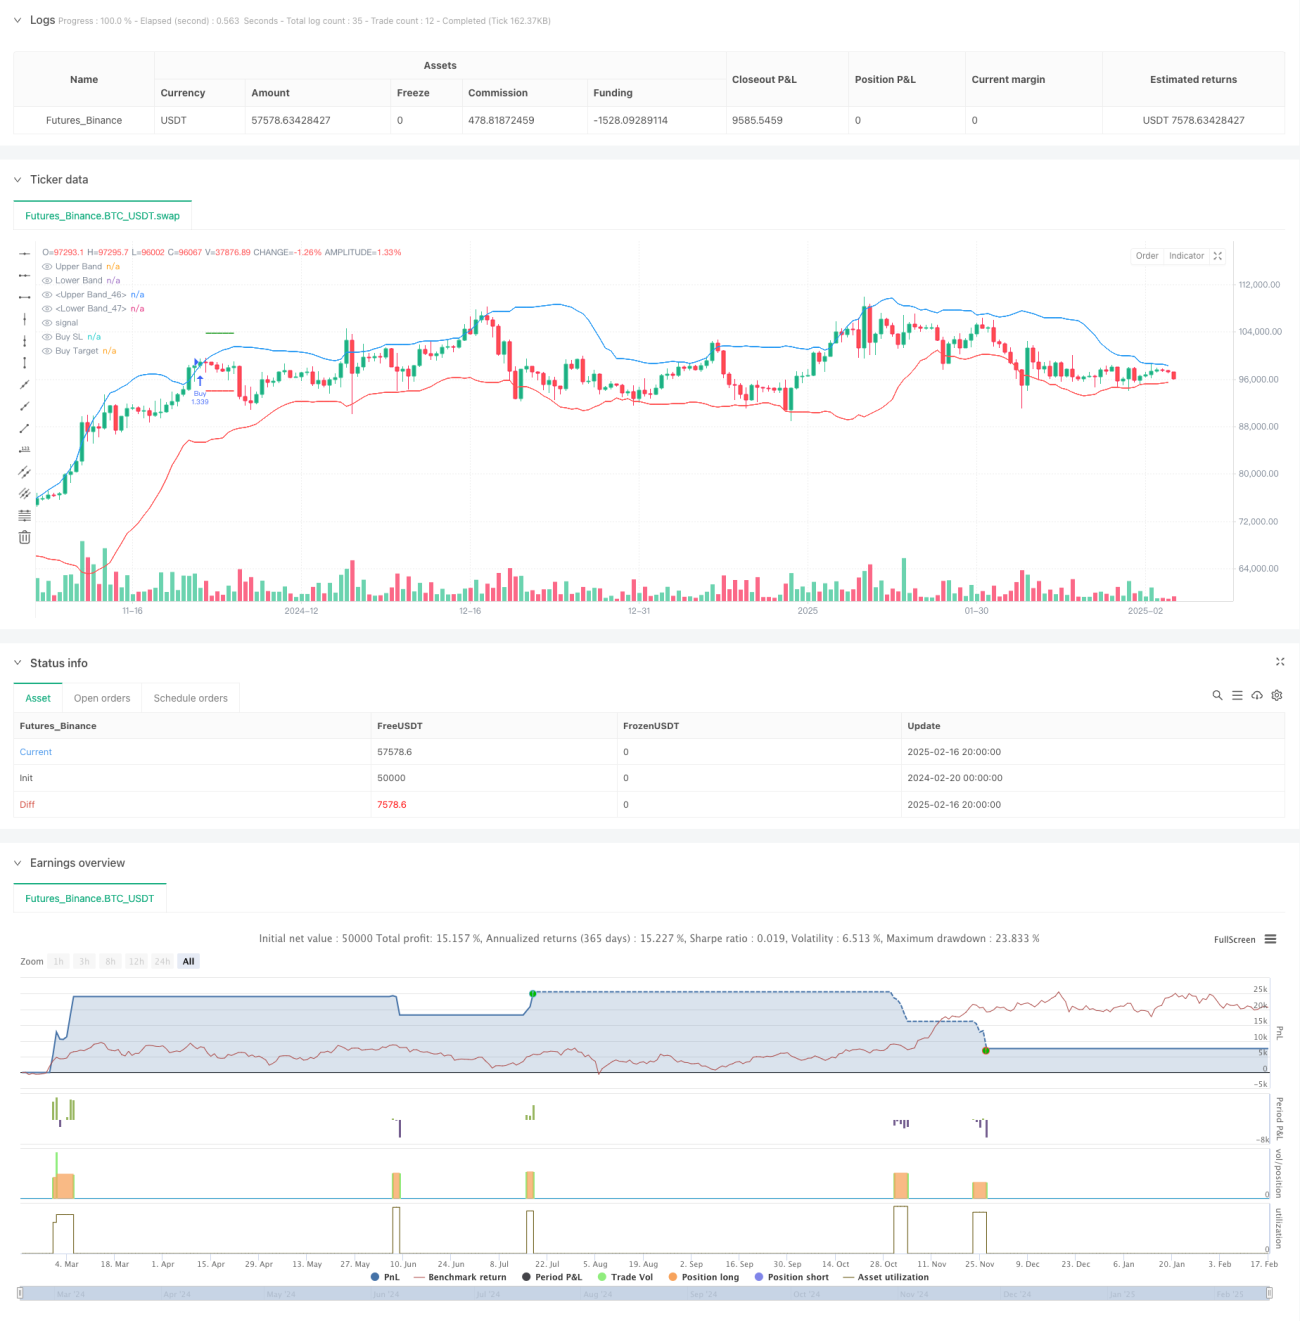
이 전략은 부린 띠의 브레이크와 <unk>라인 형태에 기반한 트렌드 추적 거래 시스템이다. 이 전략은 부린 띠의 브레이크와 <unk>라인 형태를 연속적으로 세 번 뚫은 <unk>선을 식별하고, <unk>라인 엔터티에 있는 종결 가격의 위치와 결합하여 거래 신호를 결정한다. 이 시스템은 고정된 1:1 리스크/이익 비율을 사용하여 각 거래의 스톱과 스톱을 관리한다.
전략 원칙
전략의 핵심 논리는 다음과 같은 핵심 요소에 기초합니다.
- 20주기의 브린 대역을 주요 지표로 사용하여, 표준 차이의 배수는 2.0이다.
- 다중 입점 조건: 연속으로 3개의 K선으로 상쇄가격이 경로를 돌파하고, 이 3개의 K선 모두 양선이며, 상쇄가격은 주체의 상반부에 위치한다
- 공허 입시 조건: 연속적으로 3개의 K선으로 상쇄가격이 하락하며, 이 3개의 K선 모두 음선이며, 상쇄가격은 주체의 하반부에 위치한다
- 첫 번째 신호 K 선의 극한에서 스톱 손실을 설정
- 1:1의 리스크/이익 비율에 기반하여
전략적 이점
- 복수확인 메커니즘을 사용하여 연속으로 세 번의 K선 돌파의 형태 요구 사항을 통해 가짜 돌파의 위험을 효과적으로 줄입니다.
- 종결 가격의 K선 엔티티의 위치 판단과 결합하여 트렌드 확인의 신뢰성을 강화합니다
- 고정된 리스크/이익 비율을 사용하여 포지션 관리를 함으로써 리스크를 조절할 수 있다.
- 전략 논리는 명확하고 이해하기 쉬우며 구현하기 쉽습니다.
- 표기 기능을 통해 거래 신호를 직관적으로 표시하여 분석을 쉽게 추적합니다.
전략적 위험
- 변동성이 큰 시장에서는 잘못된 신호가 자주 발생할 수 있습니다.
- 고정된 리스크/이익 비율은 강력한 추세를 충분히 파악하지 못할 수 있습니다.
- 3개의 연속 K선으로의 엄격한 요구는 잠재적인 좋은 기회를 놓칠 수 있습니다.
- 신호 K선 극치에 스톱피스 설정, 큰 파동에 스톱피스 위치 너무 멀리 할 수 있습니다
다음의 방법으로 위험을 관리하는 것이 좋습니다.
- 시장의 주기적 변동과 결합된 브린 대역 변수
- 시장 특성에 따라 조정된 위험/수익비율
- 추세 확인 지표 추가
- 정지 위치 설정 방법을 최적화
전략 최적화 방향
- 변수 최적화:
- 다른 시장 특성의 동성에 따라 브린 밴드 주기 및 표준 차이의 배수를 조정할 수 있습니다.
- 3K 라인의 요구사항을 동적 판단으로 전환하는 것을 고려하십시오.
- 신호 최적화:
- ADX 또는 트렌드 라인 같은 트렌드 확인 지표
- 수량 확인 메커니즘 도입
- <unk>이동 지표를 추가하는 것을 고려하세요.
- 포지션 관리 최적화:
- 동적인 리스크/이익 비율 설정을 구현
- 자금 관리 모듈을 추가
- 롯데백화점
- 스탠드 로즈 최적화
- 트래킹 중지 메커니즘 도입
- ATR 설정에 기반한 정지 거리
- 시간 손실을 고려하십시오.
요약하다
이것은 구조가 완전하고, 논리가 명확한 트렌드 추적 전략이다. 부린 벨트 돌파구와 <unk>라인 형태의 여러 확인 메커니즘을 통해 가짜 신호 위험을 효과적으로 감소시킨다. 고정된 위험 수익 비율 설정은 거래 관리를 단순화하지만 전략의 유연성을 제한한다. 최적화 파라미터 설정, 확인 지표의 추가, 포지션 관리의 개선 등으로 전략의 개선 공간이 여전히 많다. 전체적으로, 이것은 실질적인 가치를 가진 기본 전략 프레임워크이며, 특정 요구에 따라 추가적으로 개선할 수 있다.
Source
Pine
/*backtest
start: 2024-02-20 00:00:00
end: 2025-02-17 08:00:00
period: 12h
basePeriod: 12h
exchanges: [{"eid":"Futures_Binance","currency":"BTC_USDT"}]
*/

//@version=6
strategy("Bollinger Band Strategy (Close Near High/Low Relative to Half Range)", overlay=true, default_qty_type=strategy.percent_of_equity, default_qty_value=200, pyramiding=0)

// Bollinger BandsStrategy parameters
Related strategies
Comment
All comments (0)
No data
- 1