다중 지표 추세 추적 강화된 양적 거래 전략

1
Follow
1781
Followers
개요
이 전략은 다중 기술 지표에 기반한 트렌드 추적 전략으로, 이동 평균 ((EMA), 평균 트렌드 지표 ((ADX) 및 상대적으로 약한 지표 ((RSI) 와 같은 여러 기술 지표를 통합하고, 다중 시간 프레임 분석 방법을 결합합니다. 전략은 주로 빠른 EMA와 느린 EMA의 교차를 통해 트렌드 방향을 확인하고, ADX를 사용하여 트렌드 강도를 필터링하고, RSI를 통해 시장 움직임을 판단하여 1 분 차트에 높은 주파수 거래를 수행합니다.
전략 원칙
이 전략은 다음과 같은 핵심 메커니즘을 기반으로 작동합니다.
- 50주기 및 200주기 EMA를 사용하여 트렌드 방향을 식별하고, 빠른 선과 느린 선의 교차로 입구 신호를 확인합니다.
- ADX 지표 ((14주기) 를 사용하여 트렌드 강도를 평가하고, ADX가 25 이상일 때만 입문하여 흔들림 시장을 피합니다.
- 동력 분석을 RSI 지표 ((14주기) 와 결합하여 RSI가 30보다 낮으면 더 많은 것을 고려하고 70보다 높으면 더 적은 것을 고려하십시오.
- 4 시간 프레임의 EMA 분석을 도입하여 여러 시간 프레임 확인을 통해 트렌드 판단의 신뢰성을 강화합니다
- 다이내믹 스톱 스톱을 설정하고, 추가 시간 스톱은 입시 가격의 5%에 위치하고, 스톱 스톱은 2%에 위치하고; 포이징은 반대로
전략적 이점
- 다중 지표 크로스 검증으로 신호 신뢰성이 크게 향상
- 역동적 손해제 및 변동성에 기반한 포지션 관리를 포함한 철저한 리스크 제어 장치
- 다중 시간 프레임 분석을 사용하여 가짜 침입 위험을 효과적으로 줄입니다.
- 높은 승률과 적당한 적자율, 좋은 기대수익
- 전략 논리는 명확하고 이해하기 쉬우며 유지 관리하기 쉽습니다.
전략적 위험
- 급격한 시장 변동으로 인해 손해 차단 효과가 떨어질 수 있습니다.
- 수평 변동 시장은 거래의 빈도와 비용을 증가시킬 수 있습니다.
- EMA 지표는 그 자체로 지연되어 있으며, 가장 좋은 시점을 놓칠 수 있습니다.
- 다중 지표는 모순된 신호를 만들어 낼 수 있습니다.
- 1분 주기 거래는 실행 속도에 대한 요구가 높고, 슬라이드 포인트 위험에 직면할 수 있다.
전략 최적화 방향
- ADX 평준화 매개 변수를 최적화하여 트렌드 식별 정확도를 향상시킵니다.
- ATR 기반의 동적 포지션 관리를 도입하여 시장의 변동에 더 잘 적응합니다.
- 볼륨 분석의 차원을 확대하고 신호 신뢰성을 향상시킵니다.
- 시장 환경 분류를 추가하여 다른 시장 조건에 따라 다른 파라미터 조합을 사용하는 것을 고려하십시오.
- 기계 학습 알고리즘을 통합하여 파라미터 선택을 최적화 할 수 있습니다.
요약하다
이 전략은 여러 기술 지표의 협동적 협동으로, 안정적인 트렌드 추적 시스템을 구축한다. 전략은 높은 승률을 유지하면서, 완벽한 위험 제어 메커니즘을 통해 상당한 수익을 달성했다.
Source
Pine
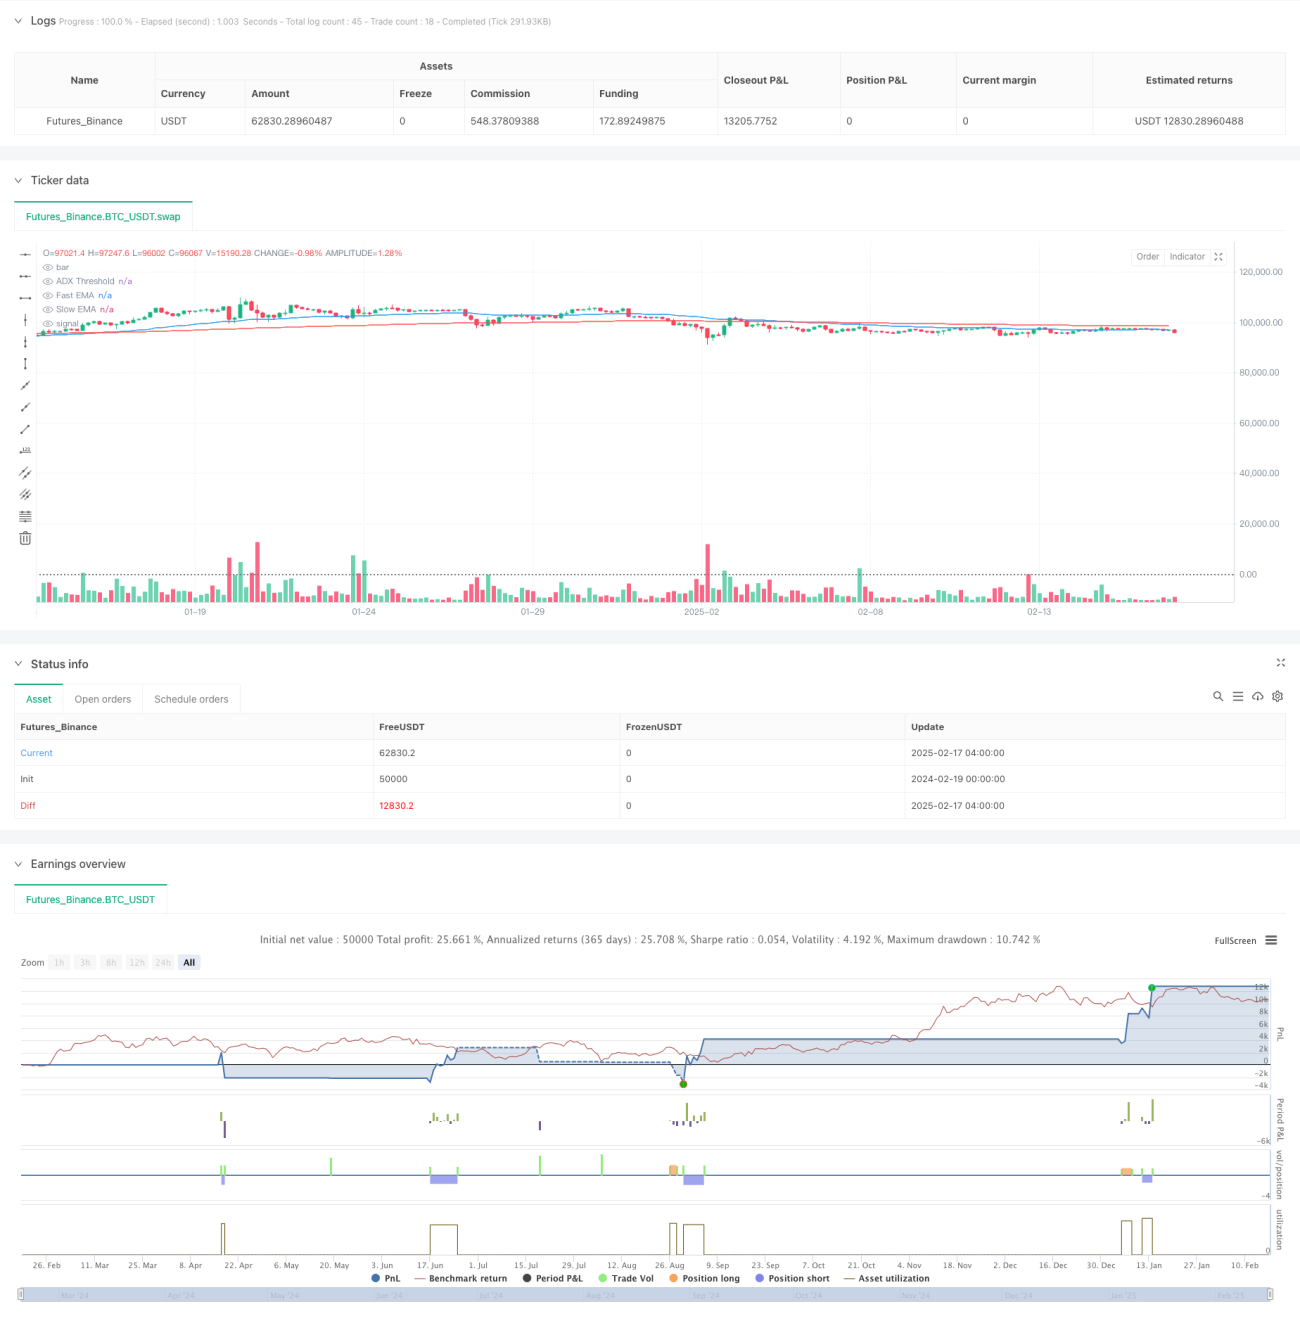
/*backtest
start: 2024-02-19 00:00:00
end: 2025-02-17 08:00:00
period: 4h
basePeriod: 4h
exchanges: [{"eid":"Futures_Binance","currency":"BTC_USDT"}]
*/

//@version=5
strategy("Enhanced Trend Following Strategy", overlay=true, default_qty_type=strategy.percent_of_equity, default_qty_value=200)

// === INPUTS ===Strategy parameters
Related strategies
Comment
All comments (0)
No data
- 1