다중 지표 동적 추세 교차 양적 거래 전략

1
Follow
1781
Followers
개요
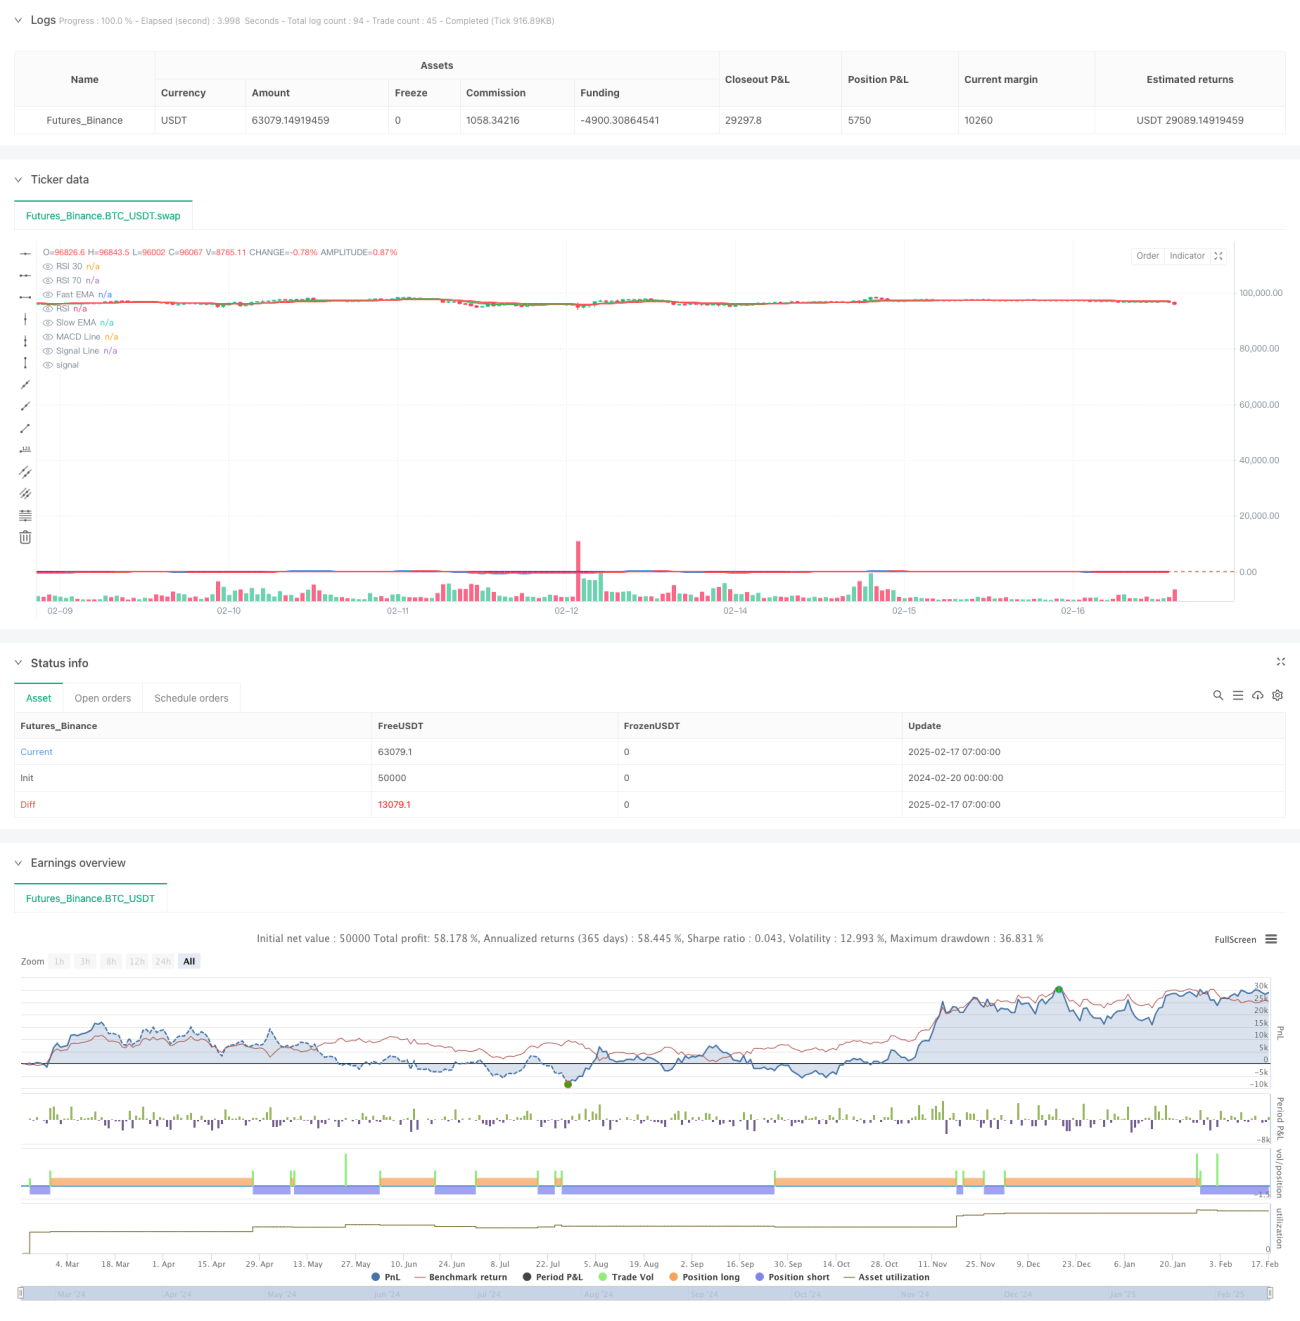
이 전략은 다중 기술 지표에 기반한 트렌드 추적 거래 시스템으로, 이동 평균 (EMA), 이동 평균 수축 지표 (MACD) 및 상대적으로 강한 지표 (RSI) 의 세 가지 클래식 기술 지표를 결합하여 시장 추세 변화와 동력을 포착하여 거래합니다. 전략은 빠른 EMA (9 주기) 및 느린 EMA (21 주기), MACD (12 주기, 26 주기) 및 RSI (14 주기) 와 같은 파라미터 설정을 사용하여 지표가 교차하고 경계를 돌파 할 때 거래 신호를 냅니다.
전략 원칙
이 전략의 핵심 논리는 여러 기술 지표의 연동 확인을 통해 시장 추세의 전환점을 식별하는 것이다. 구체적으로 다음과 같은 세 가지 측면의 신호 확인을 포함한다:
- EMA 교차 신호: 빠른 EMA를 위쪽으로 가로질러 천천히 EMA를 가로질러 다중 신호로 간주하고, 아래로 가로질러 가로질러 공백 신호로 간주한다.
- MACD 교차 신호: MACD 라인이 상향으로 신호 라인을 통과할 때 확인을 하고, 하향으로 신호 라인을 통과할 때 확인을 한다.
- RSI 필터: RSI 값이 30~70 사이일 때 거래가 허용되며, 과도한 오버 바이 오버 셀 영역에서의 거래를 피한다.
3개의 지표가 동시에 동방향 신호를 보일 때만, 전략은 그에 따른 거래 작업을 수행한다.
전략적 이점
- 여러 지표의 상호 검증으로 가짜 신호의 영향을 줄일 수 있다.
- 트렌드 추적과 동력 지표의 조합으로 시장의 전환점을 더 정확하게 포착할 수 있다.
- RSI 필터링 메커니즘은 과도한 오버 바이 오버 셀 지역 거래를 피할 수 있습니다.
- 정책 논리가 명확하여 파라미터를 조정하고 최적화 할 수 있습니다.
- 다른 시장 환경에 적응하기 위해 동시에 상장과 상외 거래를 할 수 있다.
전략적 위험
- 다중 지표 확인은 신호 지연으로 인해 최적의 출입 시간을 놓치게 할 수 있다.
- 수평 변동 시장에서 거래 비용을 증가시키는 빈번한 교차 신호가 발생할 수 있습니다.
- 고정된 RSI 경계는 다른 시장 환경에서 충분히 유연하지 않을 수 있습니다.
- 손해 중지 및 차단 장치가 설치되지 않은 경우, 큰 변동에서 큰 손실을 입을 수 있습니다.
- 기술 지표 파라미터의 선택은 충분한 역사적 데이터 검증을 거쳐야 한다.
전략 최적화 방향
- 시장의 변동에 따라 동적으로 조정하는 자율적 인 지표 파라미터를 도입하십시오.
- 단편 거래 위험을 통제하기 위한 스톱로스 스<unk> 메커니즘을 추가한다.
- 거래량 지표 검증을 늘리고 신호 신뢰도를 높여라.
- 시장 환경 인식 모듈을 개발하여 다른 시장 상태에서 다른 거래 매개 변수를 사용합니다.
- 자금 관리 모듈을 도입하여 계좌의 위험 동력에 따라 포지션 크기를 조정합니다.
- 트렌드 강도를 필터링하는 것을 고려하고 약한 트렌드에서 거래하는 것을 피하십시오.
요약하다
이 전략은 여러 기술 지표의 교차 검증을 통해 시장 추세 변화를 포착하고, 더 나은 신뢰성과 적응력을 가지고 있다. 그러나 실제 응용에서는 여전히 신호 지연 및 과도한 거래와 같은 문제를 주의해야하며, 적응 파라미터, 스톱저스 메커니즘 및 시장 환경 인식 등의 방법을 도입하여 전략의 안정성과 수익성을 높이기 위해 최적화를 권장한다. 사용 과정에서 충분한 역사적 데이터 재검토와 파라미터 최적화를 수행하고, 실제 거래 효과에 따라 지속적으로 조정 및 개선하는 것이 좋습니다.
Source
Pine
Strategy parameters
Related strategies
Comment
All comments (0)
No data
- 1