Dynamic Wave Cloud Trend ATR 손절매 전략
Ichimoku Cloud ATR Senkou Span CHIKOU SPAN SMA
생성 날짜:
2025-02-19 17:04:21
마지막으로 수정됨:
2025-02-27 17:54:39
복사:
1
클릭수:
564
개요
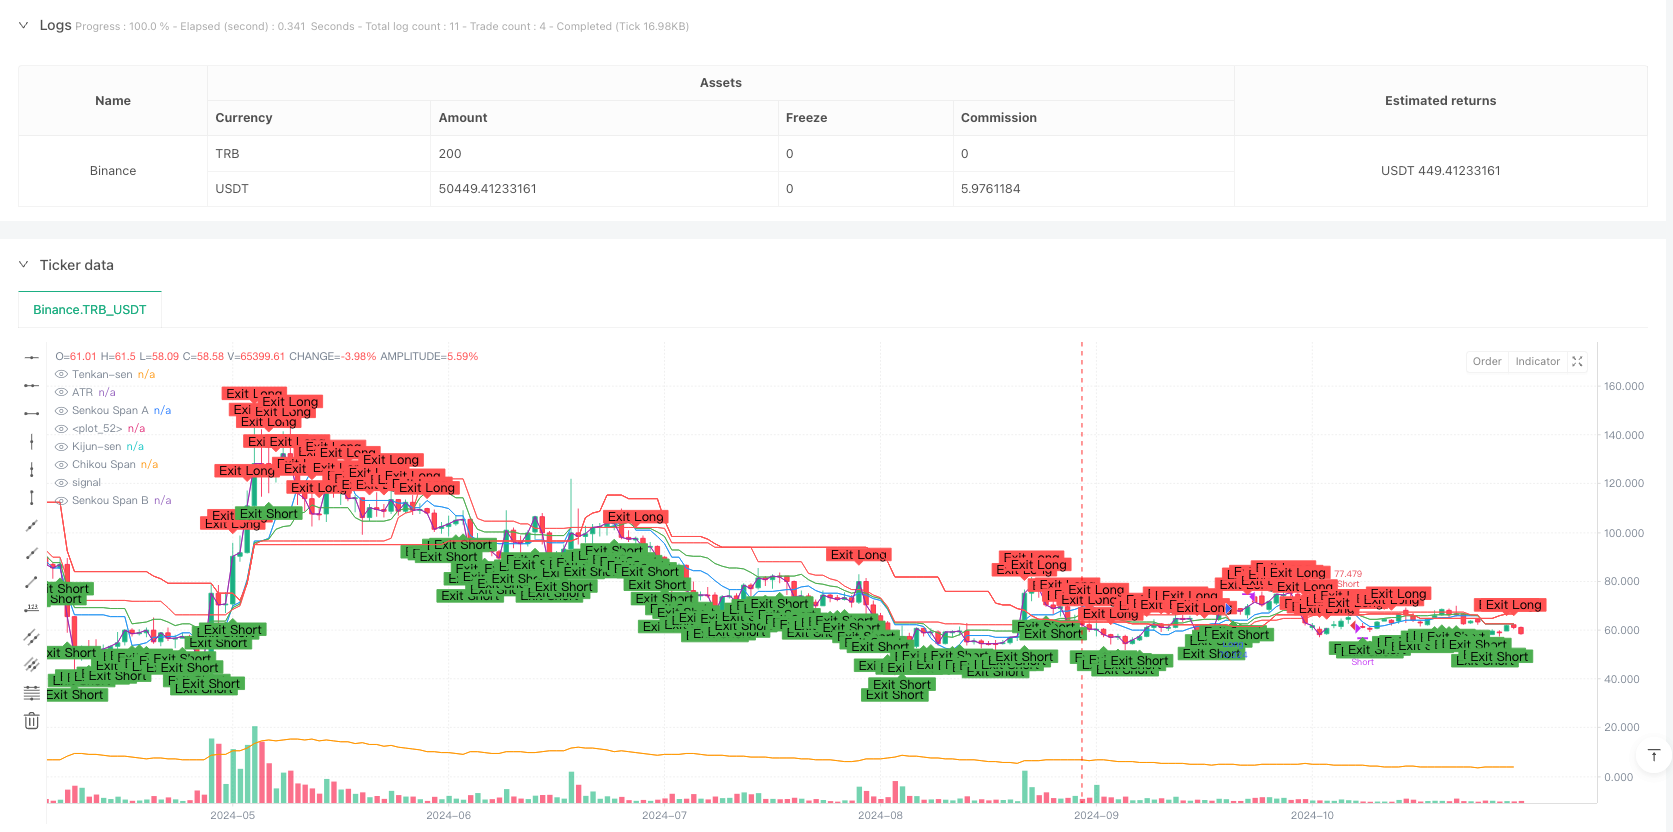
이 전략은 일회성 그래프 ((Ichimoku Cloud) 와 실제 변동의 평균값 ((ATR) 을 결합한 완전한 거래 시스템이다. 그것은 클라우드 그래프 구성 요소를 통해 시장의 추세를 식별하고, 동시에 ATR을 사용하여 동적으로 중지 위치를 조정하며, 트렌드 추적과 위험 관리를 유기적으로 결합한다. 전략은 동력과 변동률의 두 차원의 시장 정보를 통합하여 거래 결정을위한 전체적인 분석 프레임 워크를 제공합니다.
전략 원칙
전략의 핵심 논리는 초점 평형 도표의 다섯 줄과 ATR 지표 위에 있다. 시스템은 전환선 ((Tenkan-Sen) 과 기준선 ((Kijun-Sen) 의 교차로 거래 신호를 유발하며, 동시에 가격이 구름 (Senkou Span A 및 B) 의 올바른 쪽에 위치하도록 요구하며, 지연선 (Chikou Span) 의 확인을 받는다. 구체적으로:
- 다중 조건: 전환 라인에서 기준 라인을 통과하고, 가격은 클라우드 위에 있고, 지연 라인은 현재 종료 가격 위에 있습니다.
- 공백 조건: 전환 라인이 기준 라인을 통과하고, 가격은 클라우드 아래, 지연 라인은 현재 종료 가격 아래
- 스톱 손실 설정: ATR의 배수를 동적으로 조정하여 1.5배의 ATR을 기본으로 설정
- 출력 조건: 역 교차 신호 또는 지연 선 위치 변경
전략적 이점
- 다차원 확인: 트렌드, 동력 및 변동률의 여러 차원의 시장 정보를 결합하여 신호의 신뢰성을 향상시킵니다.
- 동적 위험 관리: ATR 기반의 중지 설정은 시장의 변동성에 따라 자동으로 조정할 수 있으며 고정된 중지의 결함을 피합니다.
- 체계화 된 운영: 전략 규칙이 명확하고 거래의 일관성과 규율을 유지합니다.
- 시각적 직관: 클라우드 그래프의 시각적 표시를 통해 거래자는 시장 구조를 직관적으로 이해할 수 있습니다.
- 적응력: 다양한 시장 환경에 적응할 수 있는 변수
전략적 위험
- 지연 위험: 초점 평형 도표 지표 자체는 지연성이 있으며, 진입 시기가 뒤떨어질 수 있습니다.
- 위축 시장 위험: 위축 시장에서 가짜 돌파 신호가 발생할 수 있습니다.
- 매개변수 민감도: 다양한 기간의 매개변수 설정은 전략 성과에 상당한 영향을 미칠 수 있습니다.
- 스톱 손실: ATR 배수의 선택은 보호 및 수익 공간을 균형 잡아야합니다.
- 신호 주파수: 엄격한 입시 조건으로 인해 거래 기회가 상대적으로 적을 수 있습니다.
전략 최적화 방향
- 트렌드 강도 필터를 도입합니다: 트렌드 강도를 측정하는 ADX와 같은 지표를 추가할 수 있으며, 약한 트렌드 환경을 필터링합니다.
- 최적화된 스톱 레지스 메커니즘: 스톱 레지스를 클라우드 엣지 또는 중요한 지지/저항 지점에 배치하는 것을 고려할 수 있다
- 시간 필터링: 중요한 경제 데이터 발표와 같은 높은 변동 기간을 피하십시오.
- 트랜지먼트 확인을 추가: 트랜지먼트를 신호 확인의 추가 조건으로
- 일부 포지션 관리 개발: 신호 강도 및 시장 환경에 따라 포지션 비율을 조정
요약하다
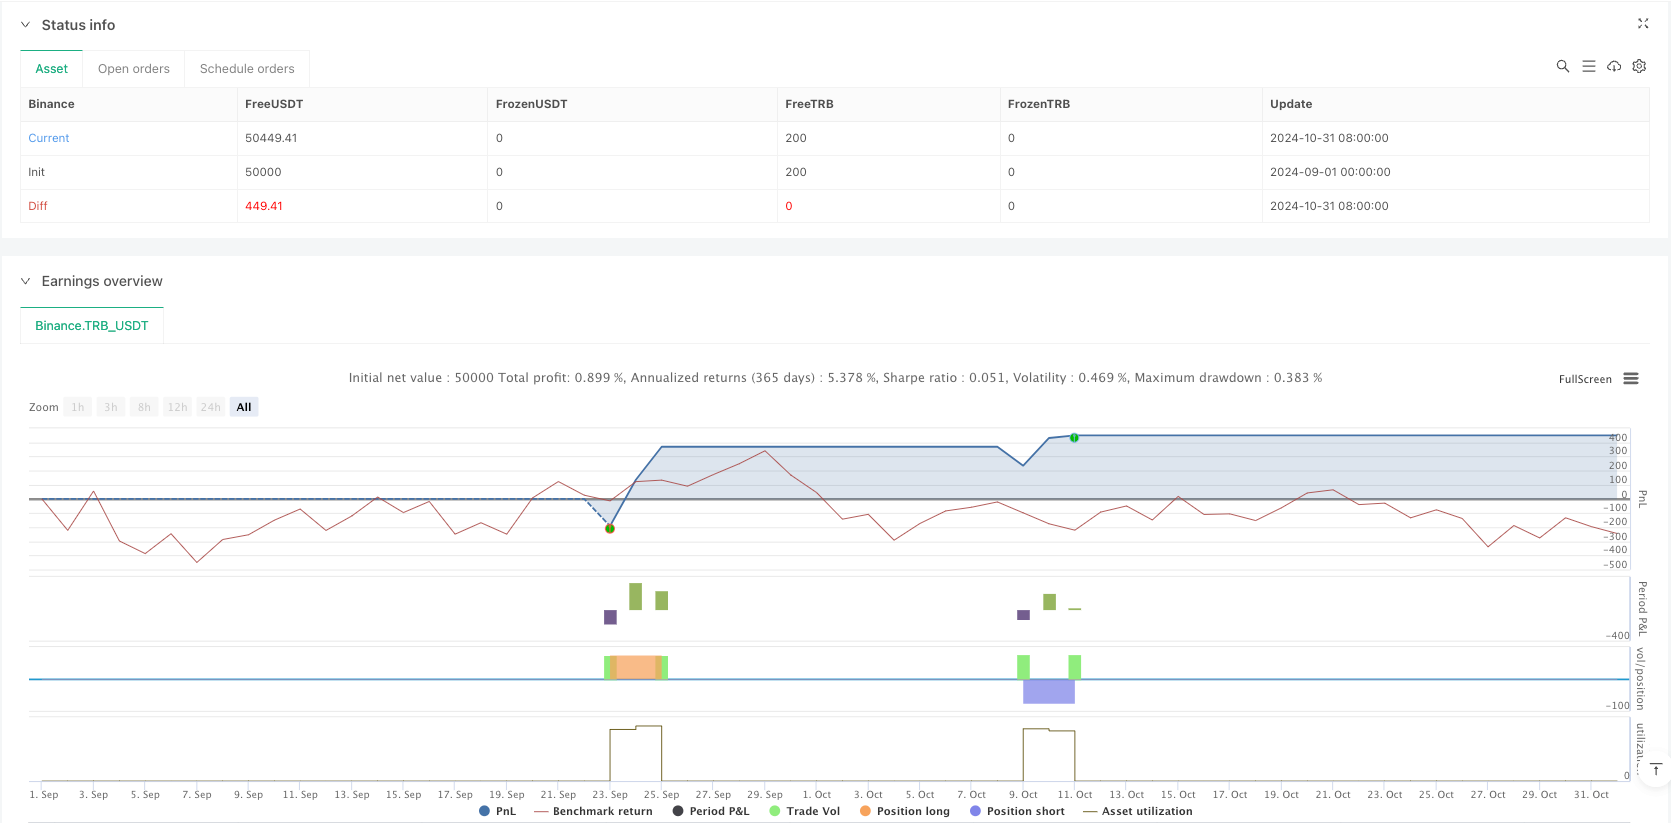
동적 파동 클라우드 트렌드 ATR 중지 전략은 고전적인 기술 분석 도구를 통합 한 완전한 거래 시스템입니다. 그것은 일목요연한 균형 도표의 여러 확인 메커니즘을 통해 트렌드를 식별하고 ATR을 사용하여 동적 위험을 제어하여 거래자에게 체계화된 의사 결정 프레임 워크를 제공합니다. 전략에는 약간의 지연성과 변수 민감성 문제가 있지만, 합리적인 최적화 및 위험 관리를 통해 트렌드 시장에서 안정적인 성능을 얻을 수 있습니다. 전략의 시각적 특성과 명확한 규칙은 체계화된 거래를 수행하려는 투자자에게 특히 적합합니다.
전략 소스 코드
/*backtest
start: 2024-09-01 00:00:00
end: 2025-02-18 00:00:00
period: 1h
basePeriod: 1h
exchanges: [{"eid":"Binance","currency":"TRB_USDT"}]
*/

//@version=5
strategy("Ichimoku Cloud + ATR Strategy", overlay=true, default_qty_type=strategy.percent_of_equity, default_qty_value=10)

// === Inputs ===
conversionPeriods = input.int(9, title="Tenkan-sen Period", minval=1)
basePeriods = input.int(26, title="Kijun-sen Period", minval=1)
laggingSpan2Periods = input.int(52, title="Senkou Span B Period", minval=1)
displacement = input.int(26, title="Displacement", minval=1)
atrLength = input.int(14, title="ATR Period", minval=1)
atrMultiplier = input.float(1.5, title="ATR Multiplier for Stop-Loss", minval=0.1, step=0.1)

// === Indicator Calculations ===
// Ichimoku Cloud
tenkan = (ta.highest(high, conversionPeriods) + ta.lowest(low, conversionPeriods)) / 2
kijun = (ta.highest(high, basePeriods) + ta.lowest(low, basePeriods)) / 2
senkouSpanA = ta.sma((tenkan + kijun) / 2, 1)
senkouSpanB = (ta.highest(high, laggingSpan2Periods) + ta.lowest(low, laggingSpan2Periods)) / 2
chikouSpan = close[displacement]

// ATR
atr = ta.atr(atrLength)

// === Entry Conditions ===
longCondition = ta.crossover(tenkan, kijun) and close > senkouSpanA and close > senkouSpanB and chikouSpan > close
shortCondition = ta.crossunder(tenkan, kijun) and close < senkouSpanA and close < senkouSpanB and chikouSpan < close

// === Entry Signals with Stop-Loss ===
if (longCondition)
    longStop = close - (atrMultiplier * atr)
    strategy.entry("Long", strategy.long)
    strategy.exit("Long Exit", from_entry="Long", stop=longStop)

if (shortCondition)
    shortStop = close + (atrMultiplier * atr)
    strategy.entry("Short", strategy.short)
    strategy.exit("Short Exit", from_entry="Short", stop=shortStop)

// === Exit Conditions ===
exitLongCondition = ta.crossunder(tenkan, kijun) or chikouSpan < close
exitShortCondition = ta.crossover(tenkan, kijun) or chikouSpan > close

if (exitLongCondition)
    strategy.close("Long")

if (exitShortCondition)
    strategy.close("Short")

// === Plotting Indicators on the Chart ===
// Ichimoku Cloud
plot(senkouSpanA, color=color.green, title="Senkou Span A")
plot(senkouSpanB, color=color.red, title="Senkou Span B")
fill(plot(senkouSpanA, color=color.green), plot(senkouSpanB, color=color.red), color=close > senkouSpanA ? color.new(color.green, 90) : color.new(color.red, 90), title="Ichimoku Cloud")

// Tenkan-sen and Kijun-sen
plot(tenkan, color=color.blue, title="Tenkan-sen")
plot(kijun, color=color.red, title="Kijun-sen")

// Chikou Span
plot(chikouSpan, color=color.purple, title="Chikou Span", offset=-displacement)

// ATR (hidden)
plot(atr, color=color.orange, title="ATR", linewidth=1, display=display.none)

// === Signal Visualization ===
// Markers for Long and Short entries
plotshape(series=longCondition, title="Long Entry", location=location.belowbar, color=color.green, style=shape.labelup, text="Long")
plotshape(series=shortCondition, title="Short Entry", location=location.abovebar, color=color.red, style=shape.labeldown, text="Short")

// Markers for Long and Short exits
plotshape(series=exitLongCondition, title="Long Exit", location=location.abovebar, color=color.red, style=shape.labeldown, text="Exit Long")
plotshape(series=exitShortCondition, title="Short Exit", location=location.belowbar, color=color.green, style=shape.labelup, text="Exit Short")