
2
Follow
478
Followers
개요
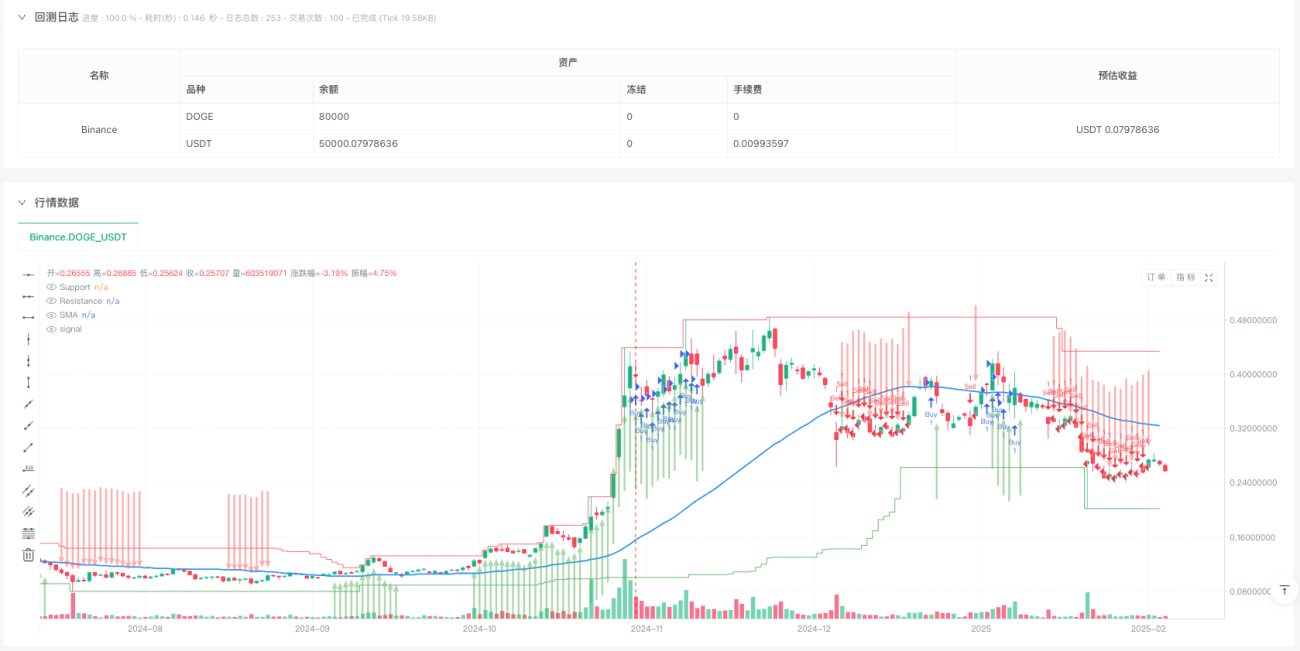
이 전략은 알브룩스 가격 행동 이론과 MACD 지표에 기반한 트렌드 추적 거래 시스템이다. 그것은 이동 평균 ((SMA) 과 MACD 지표를 결합하여 시장의 추세를 식별하고 적절한 시간에 거래를 한다. 전략은 고정된 위험 수익 비율을 사용하여 각 거래의 중지 및 중지 수준을 관리하고 위험을 효과적으로 제어한다.
전략 원칙
전략의 핵심 논리에는 다음과 같은 핵심 요소가 포함됩니다.
- 트렌드 판단: 간단한 이동 평균 ((SMA) 을 트렌드 판단의 기준으로 사용하여, 가격이 SMA 위에 있을 때 상승 추세로 판단하고, 반대로 하락 추세로 판단한다.
- 출입 신호:
- 다중 조건: 가격이 SMA 위에 있고 MACD 라인은 0보다 크고 신호 라인을 상회합니다.
- 공백 조건: 가격이 SMA 아래, MACD 라인은 0보다 작고 신호 라인을 아래로 통과
- 위험 관리:
- 고정된 퍼센티지를 사용해서
- 미리 예상된 리스크/이익비율에 기반한 스톱 포지션 계산
- 퇴출 메커니즘: 구매 또는 판매 신호가 사라지면 자동 평점 상태가 유지됩니다.
전략적 이점
- 트렌드 추적의 신뢰성: 가격 행동과 기술 지표의 결합으로 트렌드 판단의 정확성을 향상시킵니다.
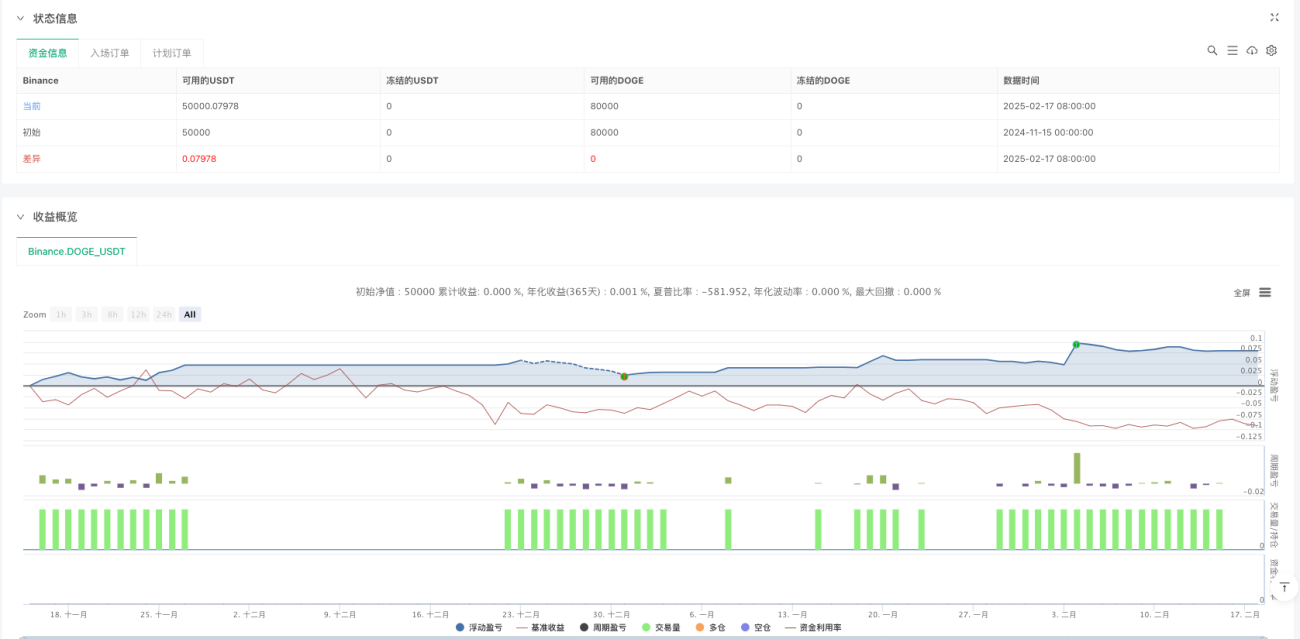
- 위험 관리의 과학성: 고정된 위험/수익 비율을 사용하여 거래별로 관리
- 신호 확인의 포괄성: 여러 조건 확인을 통해 가짜 신호를 줄인다.
- 높은 수준의 자동화: 전체적인 입출장, 출구 및 위험 관리 메커니즘을 포함
- 시각적 효과: 명확한 지지점과 저항점 표시
전략적 위험
- 트렌드 반전 위험: 트렌드 전환점에서 연속적인 가짜 신호가 발생할 수 있습니다.
- 지연의 위험: 이동 평균과 MACD 모두 지연성이 있습니다.
- 변수 민감성: 정책 효과는 변수 설정에 민감하다
- 시장 환경 의존: 불안정한 시장에서 더 많은 손실 거래가 발생할 수 있습니다.
전략 최적화 방향
- 신호 필터링: 거래량이나 변동률 지표를 추가하여 신호를 필터링할 수 있다
- 동적 변수: 고정된 리스크/이익 비율을 시장의 변동성에 기반한 동적 변수로 바꾸는 것
- 시간 필터: 거래 시간 창을 제한하여 부적절한 시간대에 거래하는 것을 방지합니다.
- 시장 정서 지표의 증대: 시장 정서 지표를 도입하여 동향의 강도를 판단하는 데 도움을 줍니다.
요약하다
이것은 고전적인 가격 행동 이론과 기술 지표들을 결합한 완전한 거래 시스템이다. 전략은 엄격한 신호 확인 메커니즘과 위험 관리 방법을 통해 비교적 안정적인 거래 효과를 달성한다. 일부 고유한 위험이 존재하지만, 제안된 최적화 방향은 전략의 안정성과 수익성을 더욱 향상시킬 수 있다.
Source
Pine
Strategy parameters
Related strategies
Comment
All comments (0)
No data
- 1