듀얼 지표 동적 추세 거래 전략: RSI 및 MACD 기반 다차원 기술 분석 시스템
RSI MACD OB(Overbought) OS(Oversold) TA(Technical Analysis)
생성 날짜:
2025-02-19 17:52:18
마지막으로 수정됨:
2025-02-27 17:53:45
복사:
5
클릭수:
546
개요
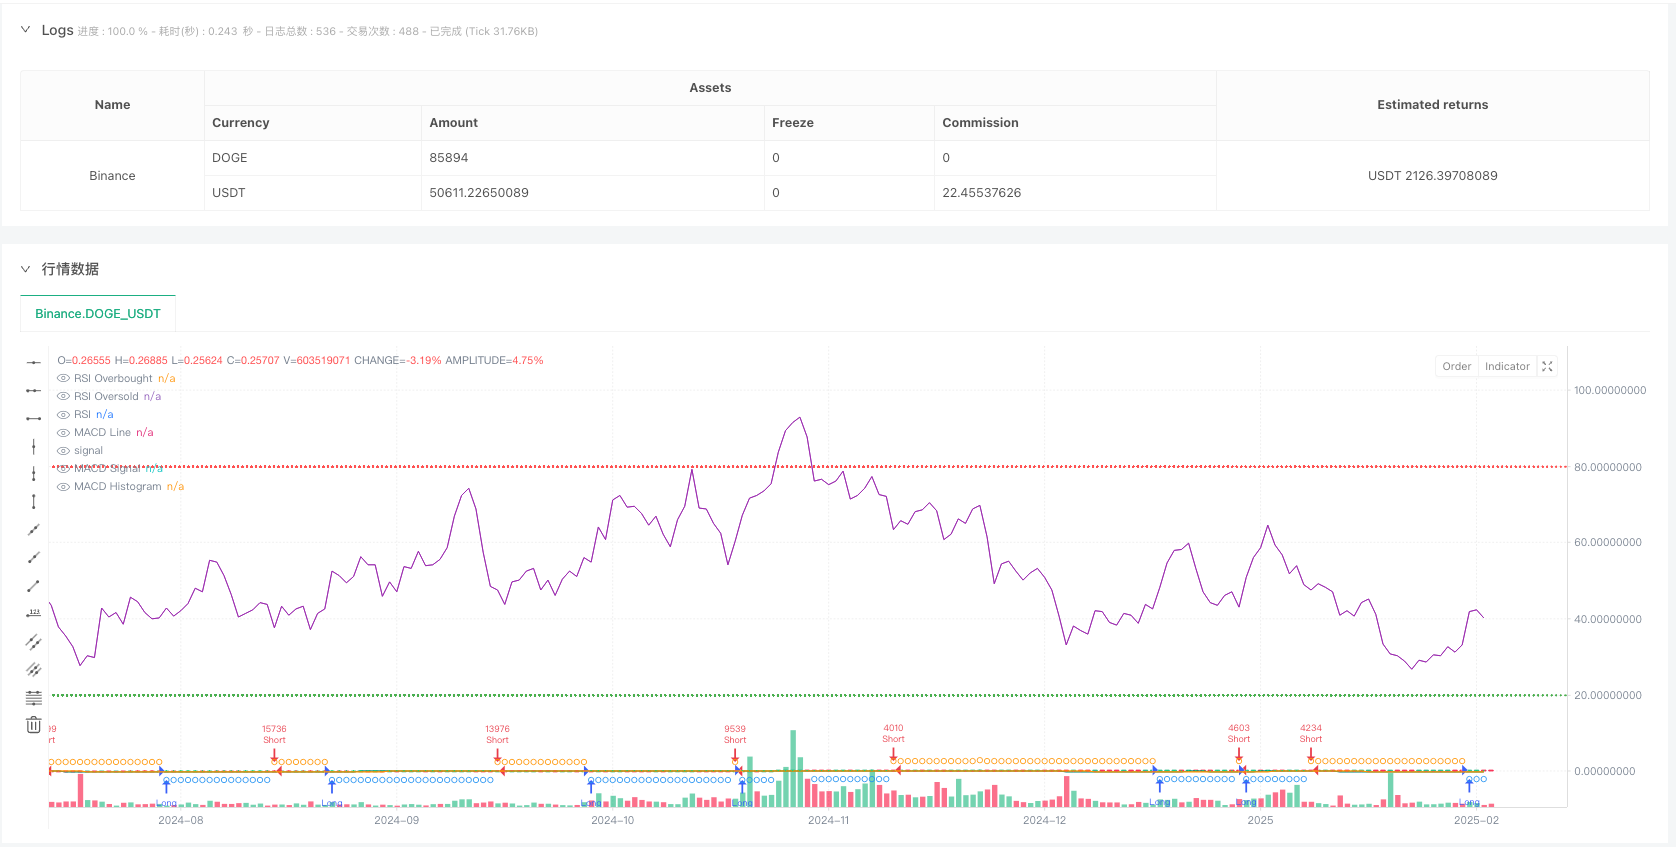
이 전략은 RSI와 MACD 이중 기술 지표에 기반한 자동화 거래 전략이다. 이 전략은 오버 바이 오버 셀 신호와 트렌드 확인을 결합하여 잠재적인 거래 기회를 식별하여 시장에 대한 정확한 파악을 가능하게 한다. 이 전략은 비율 포지션 관리를 채택하고, 슬라이드 포인트 방지 메커니즘이 내장되어 있어 실용성과 적응성이 강하다.
전략 원칙
이 전략의 핵심 논리는 다음과 같은 핵심 요소에 기반합니다.
- 상대적으로 강한 지표 ((RSI) 를 사용하여 오버 바이 오버 시드를 판단합니다. 매개 변수는 14 주기로 설정되어 있으며, 오버 바이 값은 80이며, 오버 시드는 20입니다.
- MACD ((12,26,9) 를 사용하여 트렌드 확인을 하고, MACD 선과 신호 선의 교차 인식 트렌드 변경
- 거래 신호의 생성에는 RSI와 MACD의 조건이 동시에 필요합니다.
- 다중 조건: RSI가 오버 바이에 도달하지 + MACD 라인은 신호 라인의 위에
- 공백 조건: RSI가 초매매에 도달하지 않았 + MACD 라인은 신호 라인 아래에 있습니다
- 3%의 계정 이득을 거래당 포지션 크기로 사용하고 동방 거래의 재건 포지션을 제한합니다.
전략적 이점
- 이중 기술 지표의 조합은 가짜 신호의 위험을 크게 줄이고 거래의 신뢰성을 높입니다.
- 지분 관리 방식은 자금의 동적 조정과 위험을 더 잘 통제하는 데 도움이 됩니다.
- 내장된 미끄러지지 않는 지점 메커니즘 ((3 지점) 은 실 디스크에서 전략의 적응성을 강화합니다.
- 전략적 지원: 더 많은 코스닥 거래가 시장의 기회를 최대한 활용할 수 있습니다.
- 거래 기간은 시장 특성에 따라 조정할 수 있습니다.
전략적 위험
- RSI와 MACD는 모두 지연된 지표이며 빠르게 변동하는 시장에서 충분히 반응하지 않을 수 있습니다.
- 고정 오버 바이 오버 세일 마이너스는 다른 시장 환경에 따라 조정될 수 있습니다.
- 3%의 고정 포지션은 어떤 경우에는 너무 크거나 너무 작을 수 있습니다.
- 이윤 회수 또는 손실 확장을 초래할 수 있는 스톱로스 차단 조건이 설정되지 않았습니다.
- 이중 지표의 엄격한 조건은 잠재적인 거래 기회를 놓칠 수 있습니다.
전략 최적화 방향
- 적응된 RSI 마이너스를 도입하여 시장의 변동성에 따라 동적으로 조정되는 과매매 판단 기준
- 손해 차단 장치를 추가하고 ATR 또는 변동률에 따라 동적 손해 차단을 설정하는 것이 좋습니다.
- 포지션 관리 시스템을 최적화하여 시장의 변동성과 계좌의 순가치 변화에 따라 포지션 크기를 동적으로 조정할 수 있습니다.
- 시장 환경 필터를 추가하여 다른 시장 조건에 따라 전략 매개 변수를 조정하거나 거래를 중지합니다.
- 신호의 신뢰성을 높이기 위해 보조 확인으로 트랜스포트 지표를 도입하는 것을 고려하십시오.
요약하다
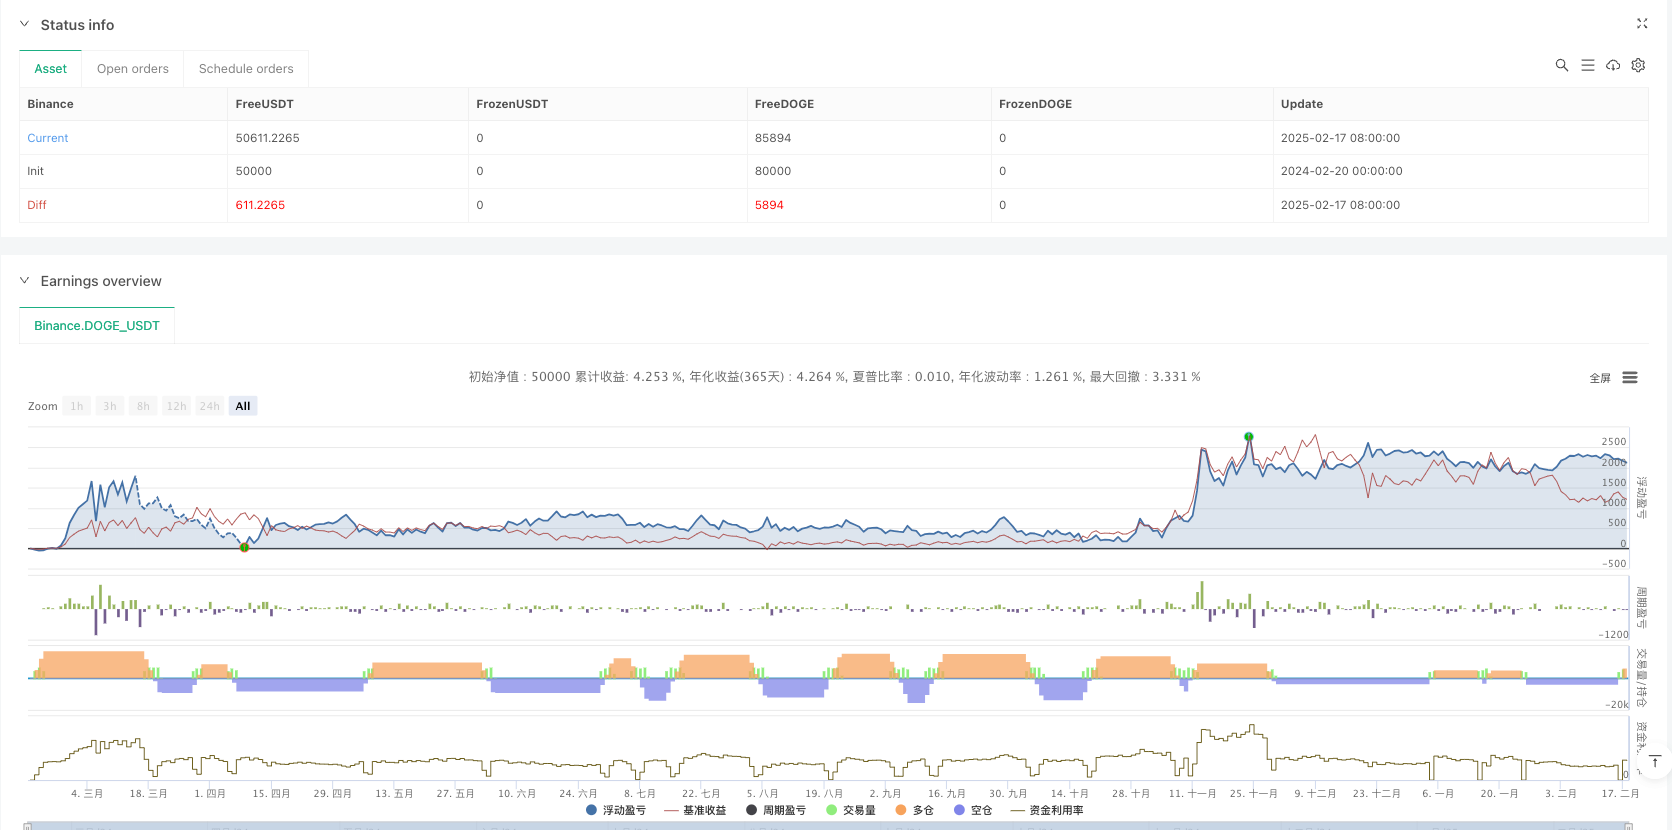
이 전략은 RSI와 MACD의 연동 작용을 통해 비교적 안정적인 거래 시스템을 구축한다. 약간의 뒤처진 위험이 있지만, 합리적인 위험 제어와 매개 변수 최적화를 통해 전략은 여전히 좋은 실용적 가치를 가지고 있다. 실제 적용 전에 충분한 재검토를 수행하고 특정 시장 특성에 따라 타겟팅 된 최적화를 수행하는 것이 좋습니다.
전략 소스 코드
//@version=6
strategy("Debugging Demo GPT",
         overlay=true,
         initial_capital=100,
         default_qty_type=strategy.percent_of_equity,
         default_qty_value=3,
         pyramiding=1,
         calc_on_order_fills=true,
         calc_on_every_tick=true,
         slippage=3)

// -----------------------------------------------------------------------
//   (1) Inputs: Start and End Date
// -----------------------------------------------------------------------


// -----------------------------------------------------------------------
//   (2) Indicators (RSI, MACD)
// -----------------------------------------------------------------------

// === RSI ===
rsiLen = input.int(14, "RSI Length")
rsiOB  = input.int(80, "RSI Overbought")
rsiOS  = input.int(20, "RSI Oversold")
rsiVal = ta.rsi(close, rsiLen)

// === MACD ===
fastLen  = input.int(12, "MACD Fast Length")
slowLen  = input.int(26, "MACD Slow Length")
sigLen   = input.int(9,  "MACD Signal Length")
[macdLine, sigLine, histLine] = ta.macd(close, fastLen, slowLen, sigLen)

// -----------------------------------------------------------------------
//   (3) Trading Logic: LONG/SHORT Filters
// -----------------------------------------------------------------------

bool rsiLongOk   = (rsiVal < rsiOB)
bool rsiShortOk  = (rsiVal > rsiOS)
bool macdLongOk  = (macdLine > sigLine)
bool macdShortOk = (macdLine < sigLine)

bool longCondition  = rsiLongOk and macdLongOk
bool shortCondition = rsiShortOk and macdShortOk

// -----------------------------------------------------------------------
//   (4) Entry Conditions
// -----------------------------------------------------------------------

// Debugging: Visualizing the conditions
plotshape(series=longCondition, location=location.belowbar, color=color.blue, style=shape.circle, title="LongCondition", size=size.tiny)
plotshape(series=shortCondition, location=location.abovebar, color=color.orange, style=shape.circle, title="ShortCondition", size=size.tiny)

// Entries only when all conditions are met
if longCondition
    strategy.entry("Long", strategy.long)
if shortCondition
    strategy.entry("Short", strategy.short)

// -----------------------------------------------------------------------
//   (5) Plotting for Visualization
// -----------------------------------------------------------------------

// RSI Plots
hline(rsiOB, "RSI Overbought", color=color.red, linestyle=hline.style_dotted)
hline(rsiOS, "RSI Oversold", color=color.green, linestyle=hline.style_dotted)
plot(rsiVal, title="RSI", color=color.purple)

// MACD Plots
plot(macdLine, color=color.teal, title="MACD Line")
plot(sigLine, color=color.orange, title="MACD Signal")
plot(histLine, style=plot.style_histogram, color=(histLine >= 0 ? color.lime : color.red), title="MACD Histogram")