EMA와 ADX 지표를 결합한 다중 시간대 동적 추세 추종 전략

2
Follow
478
Followers
개요
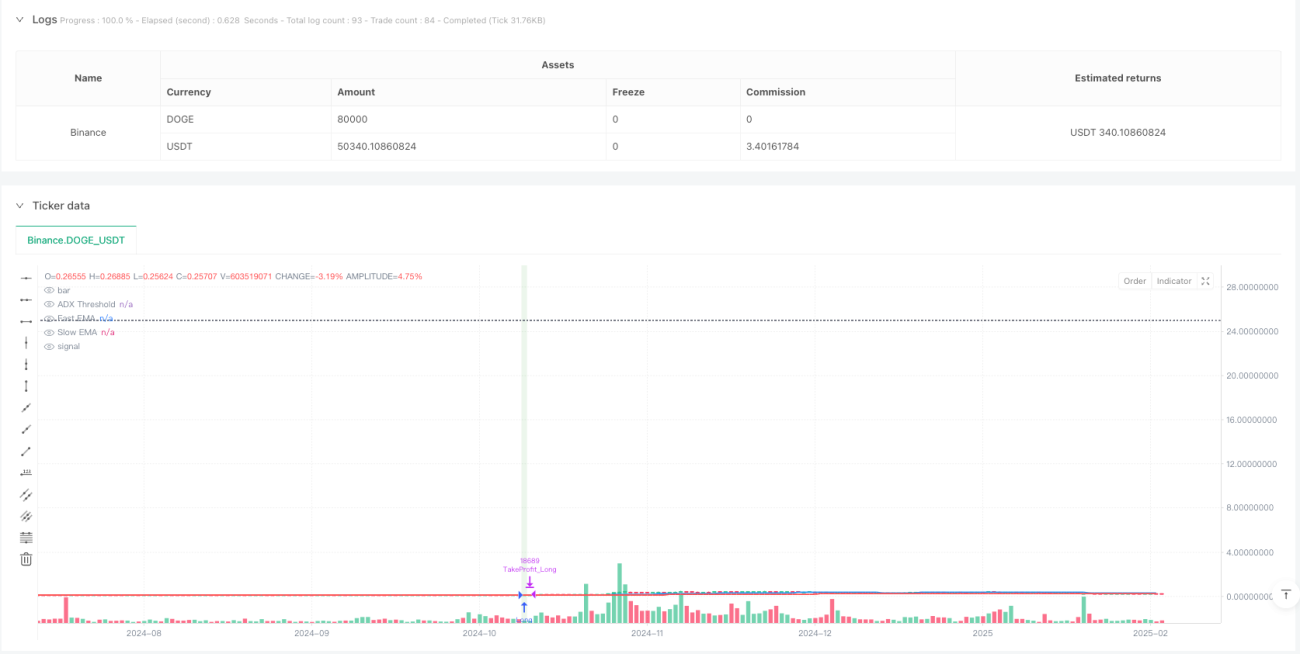
이 전략은 다중 시간 프레임 분석을 결합한 트렌드 추적 거래 시스템으로, 지수 이동 평균 ((EMA), 평균 트렌드 지수 ((ADX) 및 상대적으로 강한 지수 ((RSI) 와 같은 여러 기술 지표를 통합하여 15 분 시간 프레임에 거래합니다. 전략은 보수적인 포지션 관리 방법을 사용하며, 각 거래의 위험은 계좌 총액의 2% 이내에 제어되어 장기적으로 안정적인 수익을 얻습니다.
전략 원칙
전략은 빠른 EMA ((50주기) 와 느린 EMA ((200주기) 의 교차를 사용하여 트렌드 방향을 식별하고, ADX 지표와 결합하여 트렌드 강도를 확인한다. ADX 값이 25보다 크면 시장이 강한 트렌드 상태에 있음을 나타냅니다. RSI 지표는 RSI 값이 70에 도달하면 평소 상위, RSI 값이 30에 도달하면 평소 공백을 식별하는 오버 바이 오버 판매 상태를 식별하는 데 사용됩니다.
전략적 이점
- 다중 기술 지표의 통합은 가짜 신호의 영향을 줄이고 거래의 신뢰성을 높인다.
- 동적 스톱 스톱 손실 설정으로 시장의 변동에 따라 유연하게 조정할 수 있다.
- 보수적인 포지션 관리 전략 ((2% 리스크 제어) 은 철수 위험을 효과적으로 감소시켰다.
- 다중 시간 프레임 분석은 시장 추세에 대한 더 포괄적인 시각을 제공합니다.
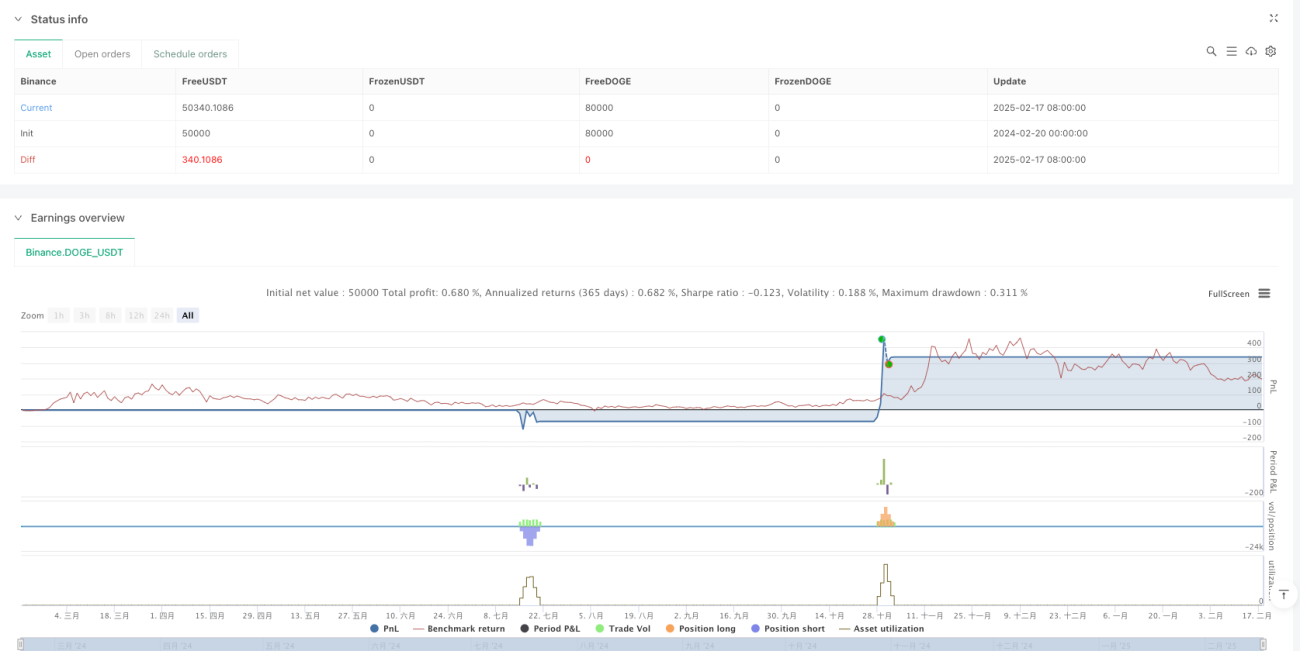
- 전략 재검토는 62.86%의 승률과 1.136의 이익 인자를 나타냅니다.
전략적 위험
- 불안정한 시장에서 거래 신호가 자주 발생하여 거래 비용이 증가할 수 있습니다.
- EMA 교차 전략은 급격한 역전 시에는 느리게 반응할 수 있다.
- 기술 지표에 지나치게 의존하면 기본적인 요소의 영향을 무시할 수 있습니다.
- 고정된 ADX <unk>값은 다른 시장 환경에서 일관되게 작동하지 않을 수 있다.
전략 최적화 방향
- 변동률 지표 ((ATR 같은) 를 도입하여 스톱 스톱 손실 수준을 동적으로 조정한다.
- 거래 신호의 추가적인 확인으로 거래량 지표를 추가하는 것을 고려하십시오.
- 다양한 시장 환경에 적응하기 위해 적응 가능한 ADX 마이너스 시스템을 개발하십시오.
- 시장 정서 지표를 추가하여 출입 시점의 정확성을 향상시킵니다.
- 여러 시간 프레임의 주기적 선택을 최적화하여 최적의 조합을 찾습니다.
요약하다
이 전략은 다차원적인 기술 분석 방법과 엄격한 위험 통제를 통해 좋은 거래 잠재력을 보여준다. 재검토에서 안정적인 성능을 보이지만, 실제 환경에서 충분히 검증해야 한다. 전략의 모듈화 설계는 강력한 적응력과 최적화 공간을 제공하며 시장 변화에 따라 유연하게 조정할 수 있다.
Source
Pine
Strategy parameters
Related strategies
Comment
All comments (0)
No data
- 1