개요
이 전략은 여러 기술 지표들을 결합한 트렌드 추적 거래 시스템이다. 그것은 주로 단순 이동 평균 (SMA) 과 지수 이동 평균 (EMA) 의 교차 신호를 기반으로 하고 있으며, 헐 이동 평균 (HMA) 트렌드 밴드, 윌리엄 지표 (%R), 휘어지는 고저점 분석 등과 같은 여러 고급 기능을 통합하여 동적 필터링 메커니즘을 통해 더 신뢰할 수 있는 거래 신호를 제공한다.
전략 원칙
이 전략의 핵심 논리는 다음과 같은 몇 가지 핵심 요소에 기반합니다.
- 주류 판단 지표로 100주기 SMA와 200주기 EMA를 사용
- 70주기를 통합한 HMA 트렌드 밴드는 트렌드 동력을 확인하는 데 사용됩니다.
- 윌리엄 지표 ((%R) 를 사용하여 동적 지원/저항 부위의 계산
- 20주기 회귀 창 검사를 통해 상승과 하락의 진동
- 실시간 모니터링 및 업데이트
- 허위 신호를 줄이기 위해 디스크 초기 필터링과 변동률 스릴값을 설정합니다.
입시 조건은 동시에 충족해야 합니다: 가격 스테이션의 쌍평균선, %R 지표는 연속으로 3개의 K선으로 상승하고 20보다 크다, K선은 닫히고 닫기 가격은 전의 선보다 높으며, 가격은 하루 내 변동 경치를 초과하지 않는다. 출구 조건은 다음 조건 중 하나를 충족한다: 가격이 쌍평균선 아래로 떨어지고, %R 지표는 80보다 낮다.
전략적 이점
- 다중 기술 지표의 공동 검증은 거래 신호의 신뢰성을 향상시킵니다
- 동적 필터링 메커니즘은 파동이 심한 기간에 가짜 신호를 효과적으로 줄여줍니다.
- 자동 적응된 지원 저항점 계산으로 전략이 시장에 잘 적응할 수 있습니다.
- 오픈 초기 필터링 및 변동성 마이너스 컨트롤을 포함한 전체 일일 거래 관리 메커니즘
- 다양한 시장 조건에 따라 최적화 할 수 있도록 변수가 조정 가능
전략적 위험
- 평선 시스템은 흔들리는 시장에서 자주 잘못된 신호를 생성할 수 있다.
- 다중 조건의 필터링은 잠재적인 거래 기회를 놓칠 수 있습니다.
- 고정 이동 평균의 주기는 다른 시장 환경에서 다르게 나타날 수 있습니다.
- 급격한 트렌드 상황 속에서 중요한 기회를 놓칠 수 있는 일일 거래 필터링 시스템
- 매개 변수를 지나치게 최적화하면 오버피칭 문제가 발생할 수 있습니다.
전략 최적화 방향
- 적응형 평선 주기 계산 기계를 도입하여 시장의 변동에 더 잘 적응할 수 있도록 한다.
- 트렌드 확인의 신뢰성을 높이기 위해 거래량 분석 지표를 추가합니다.
- 역동적인 손해배상장치를 개발하여 재무관리의 효율성을 높여주기
- 필터링 조건을 최적화하기 위한 마이너스 설정을 시장 변동률 지표에 추가함
- 다른 시간 주기의 신호 연동을 고려하여 시스템의 안정성을 강화
요약하다
이것은 잘 설계된 트렌드 추적 거래 시스템이며, 여러 기술 지표의 조합과 엄격한 필터링 메커니즘을 통해 신뢰성을 보장하면서도 유연성을 유지합니다. 전략의 최적화 공간은 주로 매개 변수의 자조성 및 위험 관리 장치의 개선에 있습니다. 거래자는 실제 사용 전에 다양한 시장 환경에서의 성능을 충분히 테스트하고 특정 상황에 따라 매개 변수 설정을 조정하는 것이 좋습니다.
전략 소스 코드
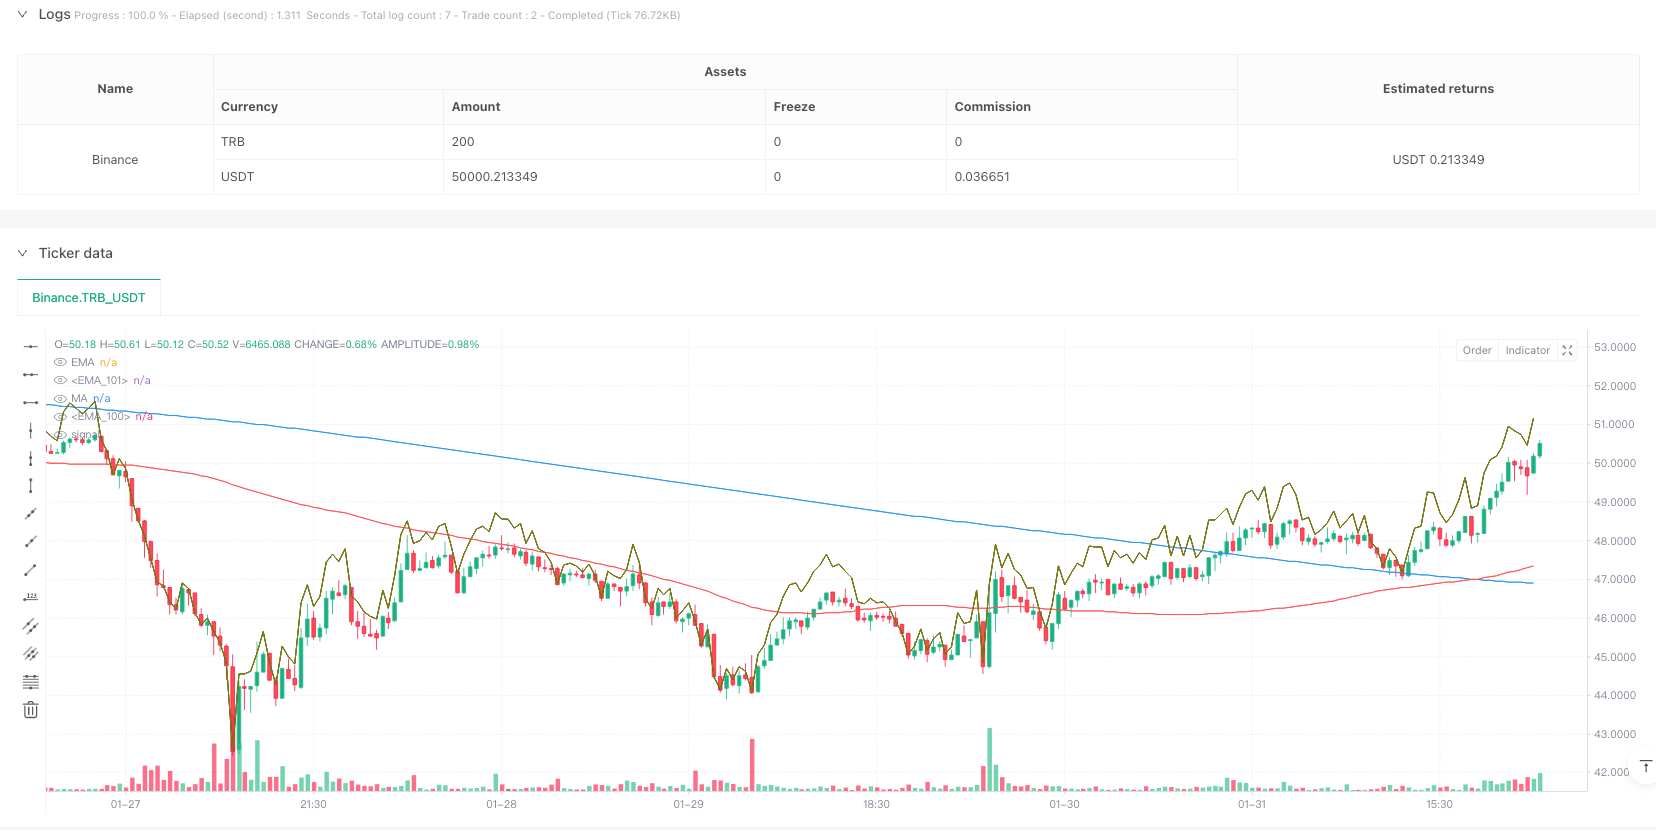
/*backtest
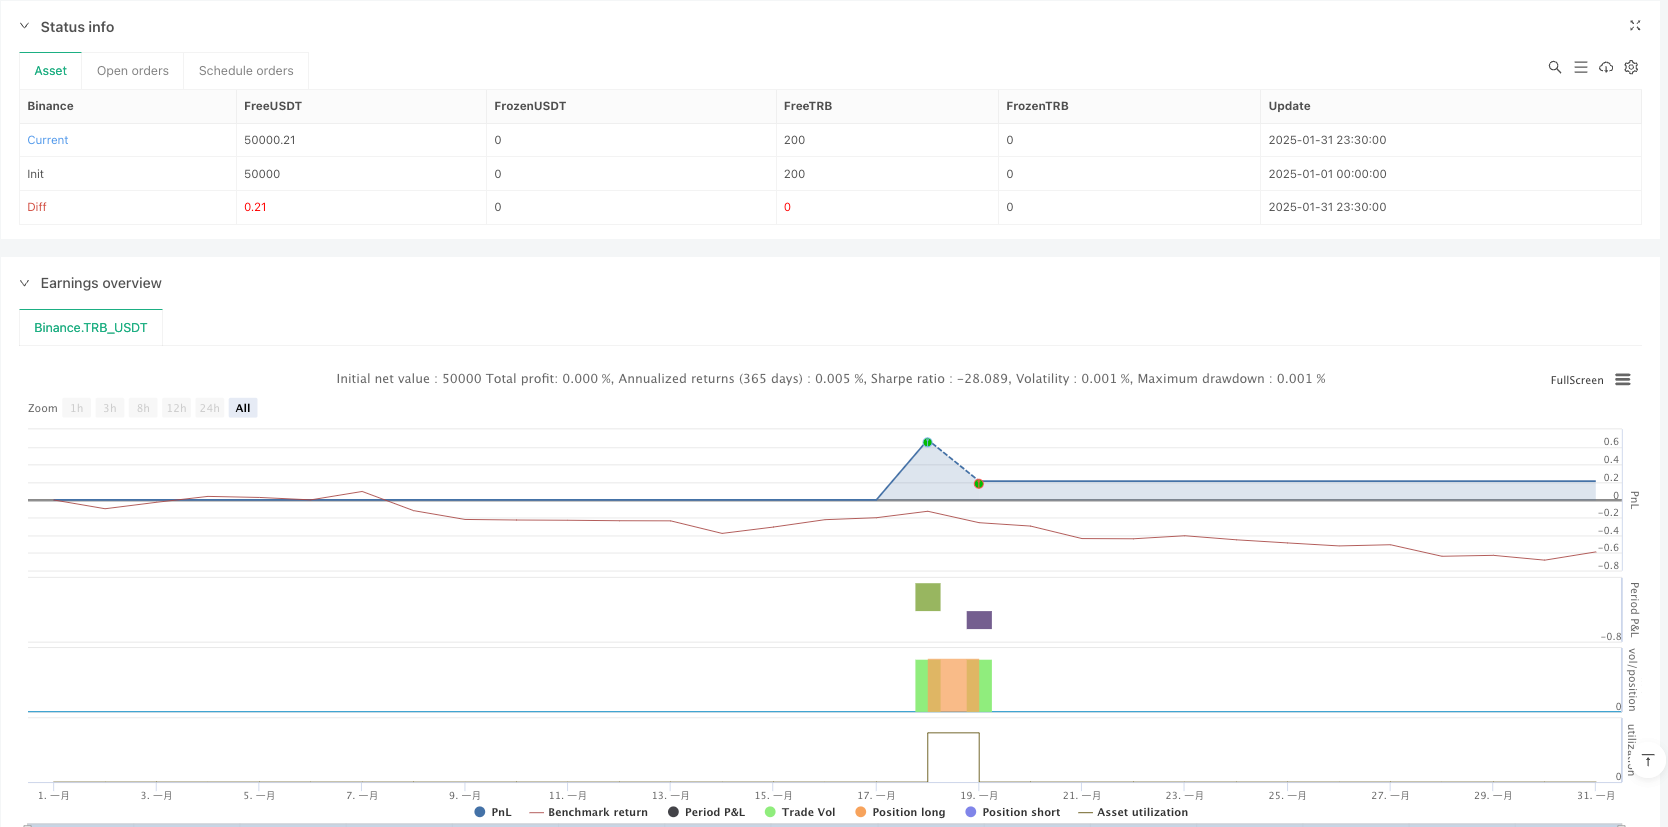
start: 2025-01-01 00:00:00
end: 2025-01-31 23:59:59
period: 30m
basePeriod: 30m
exchanges: [{"eid":"Binance","currency":"TRB_USDT"}]
*/
//@version=5
strategy(title="EMA & MA Crossover Strategy", shorttitle="EMA & MA Crossover Strategy", overlay=true)
// Inputs
LengthMA = input.int(100, minval=1, title="MA Length")
LengthEMA = input.int(200, minval=1, title="EMA Length")
swingLookback = input.int(20, title="Swing Lookback")
Lengthhmaribbon = input.int(70, minval=1, title="HMA Ribbon")
// Input for ignoring the first `n` candles of the day
ignore_n_candles = input.int(1, "Ignore First N Candles", minval=0)
// Input for percentage threshold to ignore high run-up candles
run_up_threshold = input.float(0.5, "Run-up Threshold (%)", minval=0.0)
//====================================================================
hmacondition = ta.hma(close,Lengthhmaribbon)> ta.hma(close,Lengthhmaribbon)[1]
//====================================================================
// Function to drop the first `n` candles
dropn(src, n) =>
na(src[n]) ? na : src
// Request data with the first `n` candles dropped
valid_candle = not na(dropn(close, ignore_n_candles))
// Check for run-up condition on the previous candle
prev_run_up = (high[1] - low[1]) / low[1] * 100
// Combine conditions: exclude invalid candles and ignore high run-up candles
valid_entry_condition = valid_candle and prev_run_up <= run_up_threshold
//======================================================
// Define the start of a new day based on time
var is_first = false
var float day_high = na
var float day_low = na
// Use time() to detect the start of a new day
t = time("1440") // 1440 = 60 * 24 (one full day in minutes)
is_first := na(t[1]) and not na(t) or t[1] < t
if is_first and barstate.isnew
day_high := high
day_low := low
else
day_high := nz(day_high[1], high)
day_low := nz(day_low[1], low)
// Update daily high and low
if high > day_high
day_high := high
if low < day_low
day_low := low
//====================================================
previousdayclose = request.security(syminfo.tickerid, "D", close)
day_highrange = previousdayclose*.018
//======================================================
length = input(title="Length", defval=14)
src = input(close, "Source")
_pr(length) =>
max = ta.highest(length)
min = ta.lowest(length)
100 * (src - max) / (max - min)
percentR = _pr(length)
//======================================================
higherline = close* 1+((100-(percentR*-1))/100)
lowerline = close* 1-((100-(percentR*-1))/100)
//======================================================
// Moving Averages
xMA = ta.sma(close, LengthMA)
xEMA = ta.sma(xMA, LengthEMA)
// Plot the MA and EMA lines
plot(xMA, color=color.red, title="MA")
plot(xEMA, color=color.blue, title="EMA")
// Find recent swing high and low
recentHigh = ta.highest(high, swingLookback)
recentLow = ta.lowest(low, swingLookback)
//===============================================
emacondition = ta.ema(close,20)>ta.ema(close,30) and ta.ema(close,30)>ta.ema(close,40) and ta.ema(close,40)>ta.ema(close,50) and close >ta.ema(close,20)
// Define Buy Condition
buyCondition1 = (percentR>percentR[1] and percentR[1]>percentR[2] and percentR[2]>percentR[3]) and percentR>-20 and percentR[1]>-20
buyCondition = (close> xMA and close> xEMA) and (close > open and close > close[1]) or xMA>xEMA and close<day_highrange and hmacondition and emacondition
// Define Sell Conditions
sellCondition = (close < xMA and close < xEMA) or xMA<xEMA or percentR<-80
// Strategy Execution
if (buyCondition and buyCondition1 and valid_entry_condition)
strategy.entry("Buy", strategy.long)
if (sellCondition)
strategy.close("Buy") // Close the long position
// Candle coloring for buy/sell indication
barcolor(buyCondition ? color.green : sellCondition ? color.red : na)
plot(higherline, color=color.olive, title="EMA")
plot(higherline, color=color.black, title="EMA")