
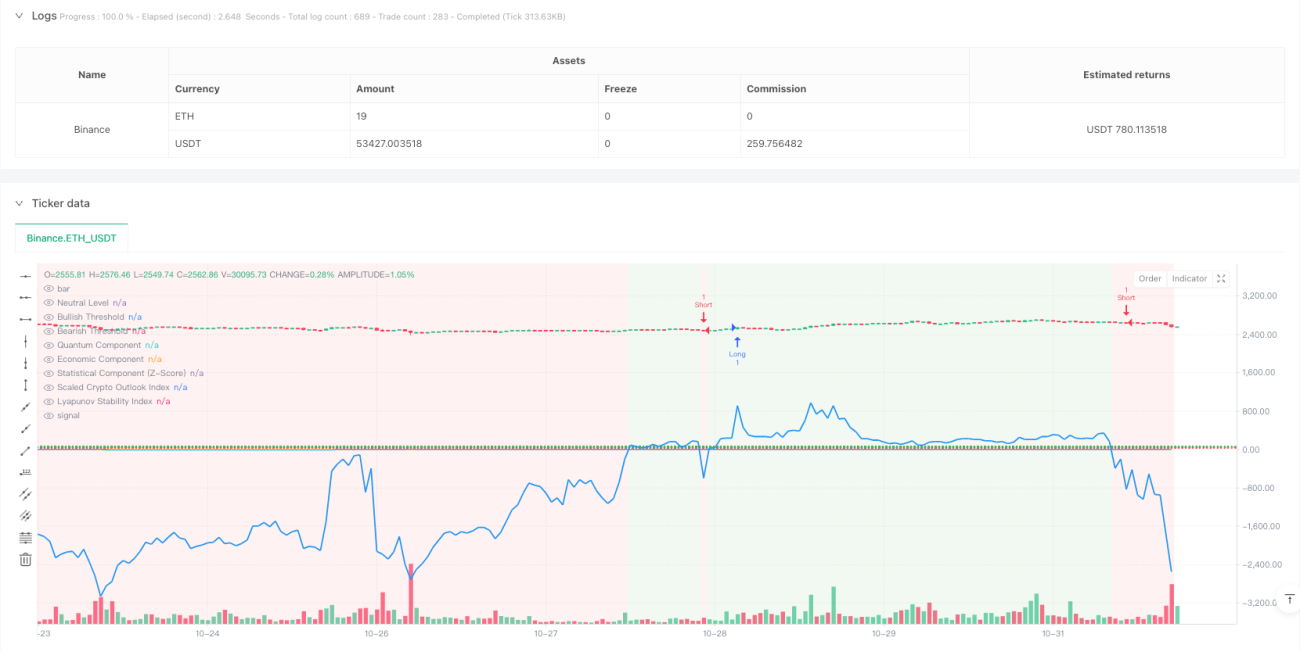
이 전략은 양자역학, 통계학, 경제학 원리를 결합한 혁신적인 양자 거래 시스템이다. 그것은 간단한 이동 평균 (SMA), Z-Score 통계 분석, 양자 변동 구성 요소, 경제 동력 지표 및 리야프노프 안정성 지수를 결합하여 포괄적인 시장 분석 프레임워크를 구축한다. 전략의 핵심은 이러한 다차원 지표의 중화 조합을 통해 통합 시장 전망 지표 (COI) 를 생성하여 거래 결정을 안내하는 것이다.
이 전략은 다섯 가지 주요 기술 기둥에 기반을 두고 있습니다.
이 전략은 혁신적인 양적 거래 전략으로, 다학제 이론을 결합하여 포괄적 인 시장 분석 프레임 워크를 구축합니다. 최적화가 필요한 부분이 있지만, 다차원 분석 방법은 거래 의사 결정에 독특한 시각을 제공합니다. 지속적인 최적화 및 위험 관리 개선으로, 이 전략은 다양한 시장 환경에서 안정적인 성능을 유지할 것으로 예상됩니다.
/*backtest
start: 2024-03-08 18:40:00
end: 2024-11-01 00:00:00
period: 1h
basePeriod: 1h
exchanges: [{"eid":"Binance","currency":"ETH_USDT"}]
*/
// This Pine Script™ code is subject to the terms of the Mozilla Public License 2.0 at https://mozilla.org/MPL/2.0/
// © Quantum-Lukas 2.0
//@version=6
strategy("Quantum Spectral Crypto Trading", shorttitle="QSCT", overlay=true, precision=2)
// ──────────────────────────────────────────────────────────────
// Input Parameters
// ──────────────────────────────────────────────────────────────
smaLength = input.int(50, title="SMA Length (Quantum & Statistical Component)", minval=1)
emaFastLength = input.int(20, title="EMA Fast Length (Economic Component)", minval=1)
emaSlowLength = input.int(50, title="EMA Slow Length (Economic Component)", minval=1)
quantumWeight = input.float(20.0, title="Quantum Component Weight", step=0.1)
economicWeight = input.float(30.0, title="Economic Component Weight", step=0.1)
statisticalWeight = input.float(20.0, title="Statistical Component Weight", step=0.1)
lyapunovWeight = input.float(10.0, title="Lyapunov Stability Weight", step=0.1)
// ──────────────────────────────────────────────────────────────
// Price Averages and Volatility Calculation
// ──────────────────────────────────────────────────────────────
smaPrice = ta.sma(close, smaLength)
stdevPrice = ta.stdev(close, smaLength)
// ──────────────────────────────────────────────────────────────
// Statistical Component: z-score Calculation
// ──────────────────────────────────────────────────────────────
z = (close - smaPrice) / stdevPrice
// ──────────────────────────────────────────────────────────────
// Quantum Component: Inspired by Quantum Mechanics
// ──────────────────────────────────────────────────────────────
quantum_component = math.exp(-0.5 * z * z) * (1 + math.sin((math.pi / 2) * z))
// ──────────────────────────────────────────────────────────────
// Economic Component: EMA Ratio as a Proxy for Market Momentum
// ──────────────────────────────────────────────────────────────
emaFast = ta.ema(close, emaFastLength)
emaSlow = ta.ema(close, emaSlowLength)
economic_component = math.log(emaFast / emaSlow)
// ──────────────────────────────────────────────────────────────
// Lyapunov Exponent for Market Stability (Prevents Log(0) Error)
// ──────────────────────────────────────────────────────────────
lyapunov_index = ta.sma(math.log(math.max(1e-10, math.abs(economic_component + quantum_component))), smaLength)
// ──────────────────────────────────────────────────────────────
// Composite Crypto Outlook Index Calculation (Fixed Indentation)
// ──────────────────────────────────────────────────────────────
crypto_outlook_index =
50 + quantumWeight * (quantum_component - 1) +
economicWeight * economic_component +
statisticalWeight * z +
lyapunovWeight * lyapunov_index
// ──────────────────────────────────────────────────────────────
// Plotting and Visual Enhancements
// ──────────────────────────────────────────────────────────────
// Normalized for better visibility in the BTC/USD chart range
normalized_outlook_index = (crypto_outlook_index - 50) * close / 100
plot(normalized_outlook_index, title="Scaled Crypto Outlook Index", color=color.blue, linewidth=2)
// Debugging: Plot each component separately
plot(quantum_component, title="Quantum Component", color=color.purple, linewidth=1)
plot(economic_component, title="Economic Component", color=color.orange, linewidth=1)
plot(z, title="Statistical Component (Z-Score)", color=color.yellow, linewidth=1)
plot(lyapunov_index, title="Lyapunov Stability Index", color=color.aqua, linewidth=1)
hline(50, title="Neutral Level", color=color.gray)
hline(70, title="Bullish Threshold", color=color.green, linestyle=hline.style_dotted)
hline(30, title="Bearish Threshold", color=color.red, linestyle=hline.style_dotted)
// Background color for bullish/bearish conditions
bgcolor(crypto_outlook_index > 50 ? color.new(color.green, 90) : color.new(color.red, 90), title="Outlook Background")
// ──────────────────────────────────────────────────────────────
// Trading Strategy: Entry and Exit Conditions (Fixed Errors)
// ──────────────────────────────────────────────────────────────
// Define entry conditions
longCondition = crypto_outlook_index > 70
shortCondition = crypto_outlook_index < 30
// Execute long entry
if (longCondition)
strategy.entry("Long", strategy.long)
// Execute short entry
if (shortCondition)
strategy.entry("Short", strategy.short)
// Define exit conditions (Added Stop Losses)
if (crypto_outlook_index < 50)
strategy.exit("Exit Long", from_entry="Long", stop=low)
if (crypto_outlook_index > 50)
strategy.exit("Exit Short", from_entry="Short", stop=high)