다중 지표 추세 모멘텀 ATR 목표 가격 거래 전략

ADX RSI ATR SMA
생성 날짜: 2025-02-20 10:03:36 마지막으로 수정됨: 2025-02-27 17:51:29
복사: 1 클릭수: 353
avatar of ianzeng123 ianzeng123
2
집중하다
319
수행원

다중 지표 추세 모멘텀 ATR 목표 가격 거래 전략 다중 지표 추세 모멘텀 ATR 목표 가격 거래 전략

개요

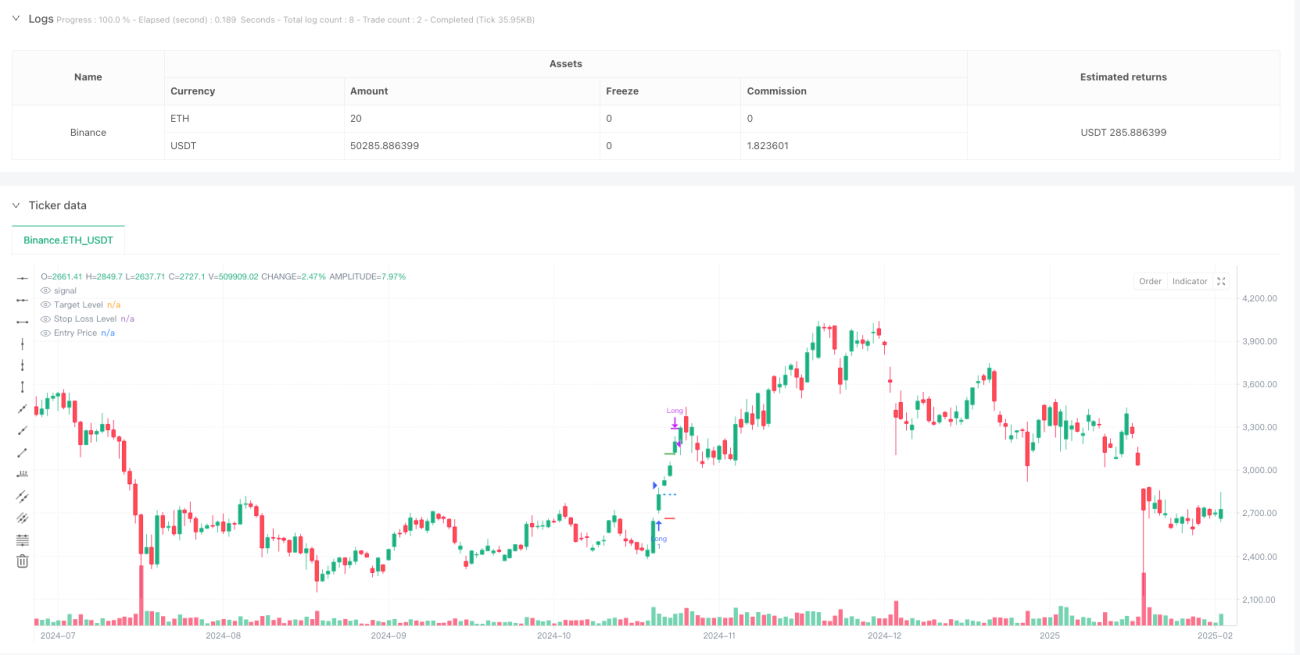
이 전략은 다중 기술 지표에 기반한 트렌드 추적 및 동력 거래 시스템이다. 그것은 주로 평균 트렌드 지표 ((ADX), 상대적으로 강한 지표 ((RSI) 및 실제 파도 ((ATR) 를 결합하여 잠재적인 다중 기회를 식별하고 ATR를 사용하여 동적인 수익 및 중단 가격을 설정한다. 이 전략은 1 분 시간 주기 옵션 거래에 특히 적합하며, 엄격한 입장 조건과 위험 관리를 통해 거래의 성공률을 높인다.

전략 원칙

전략의 핵심 논리에는 다음과 같은 핵심 구성 요소가 포함됩니다.

  1. 트렌드 확인: ADX>18과 +DI가 -DI보다 크다는 것을 사용하여 시장이 상승 추세에 있음을 확인한다.
  2. 운동량 검증: RSI가 60을 돌파하고 20주기 이동 평균 위에 있는 것을 요구하며, 가격 운동량을 검증한다.
  3. 진입 시점: 트렌드 및 동력 조건이 동시에 충족될 때, 시스템은 현재 종료 가격에서 다중 포지션을 구축한다.
  4. 목표 관리: 입점 당시의 ATR 값에 기반하여 동적으로 설정된 수익 목표 ((2. 5배 ATR) 와 중지 손실 ((1. 5배 ATR)

전략적 이점

  1. 다차원 확인: 트렌드 및 동력 지표를 결합하여 더 신뢰할 수 있는 거래 신호를 제공합니다.
  2. 동적 위험 관리: ATR을 사용하여 시장의 변동성에 적응하기 위해 스톱 스톱 손실 위치를 동적으로 조정합니다.
  3. 명확한 거래 규칙: 출입 및 출입 조건이 명확하여 주관적 판단의 방해를 줄입니다.
  4. 적응성: 전략 매개 변수는 다른 시장 환경과 거래 유형에 따라 최적화 조정할 수 있습니다.

전략적 위험

  1. 가짜 브레이크 위험: RSI가 60을 넘으면 가짜 신호가 발생할 수 있으며, 다른 지표와 함께 검증해야 한다.
  2. 슬라이드 포인트 영향: 1분 사이클의 빠른 시장에서, 큰 슬라이드 포인트 위험에 직면할 수 있다.
  3. 시장 환경 의존성: 전략이 트렌드가 뚜렷한 시장에서 더 잘 작동하며, 흔들리는 시장은 종종 중지 손실을 유발할 수 있습니다.
  4. 매개 변수 민감성: 여러 지표 매개 변수의 설정은 균형이 필요하며, 잘못된 매개 변수 조합은 정책 성능에 영향을 줄 수 있다.

전략 최적화 방향

  1. 입구 최적화: 수량 확인 메커니즘을 추가하여 신호 신뢰도를 높일 수 있다.
  2. 포지션 관리: 동적 포지션 관리 시스템을 도입하여 시장의 변동성에 따라 포지션 규모를 조정한다.
  3. 출구 메커니즘: 수익을 더 잘 보호할 수 있는 추적 중지 기능을 추가하는 것을 고려할 수 있다.
  4. 시간 필터: 거래 시간 창 필터를 추가하여 과도한 변동성 또는 유동성이 부족한 시기를 피하십시오.

요약하다

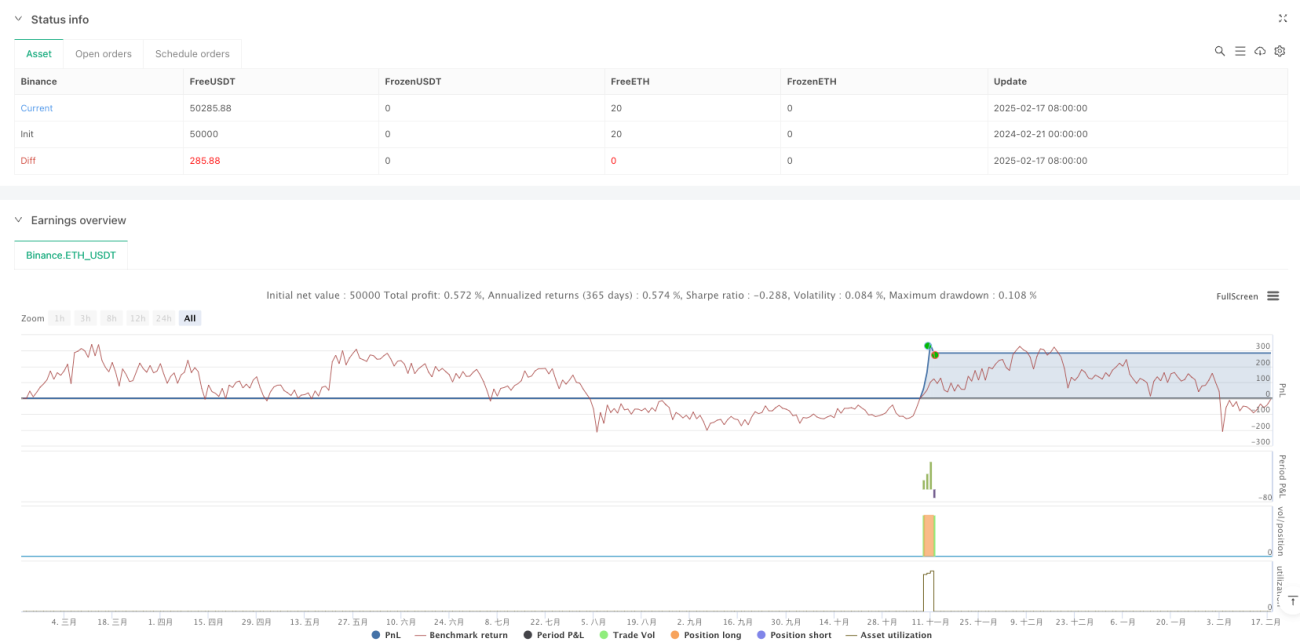
이 전략은 여러 가지 기술 지표를 통합하여 전체적인 거래 시스템을 구축한다. 이 전략의 장점은 트렌드 및 동적 분석을 결합하고 동적인 위험 관리 방법을 채택하는 것이다. 특정 위험이 존재하지만 합리적인 매개 변수 최적화 및 위험 제어 조치를 통해 실제 거래에서 안정적인 성과를 얻을 수 있다.

전략 소스 코드
/*backtest
start: 2024-02-21 00:00:00
end: 2025-02-18 08:00:00
period: 1d
basePeriod: 1d
exchanges: [{"eid":"Binance","currency":"ETH_USDT"}]
*/

// This Pine Script™ code is subject to the terms of the Mozilla Public License 2.0 at https://mozilla.org/MPL/2.0/
// © SPcuttack

//@version=6
strategy("ADX & RSI Strategy with ATR Targets", overlay=true)

// Input parameters
adxLength = input.int(14, title="ADX Length")
adxSmoothing = input.int(14, title="ADX Smoothing")
rsiLength = input.int(14, title="RSI Length")
rsiSmaLength = input.int(20, title="RSI SMA Length")
atrLength = input.int(14, title="ATR Length")
atrMultiplierTarget = input.float(2.5, title="ATR Multiplier for Target")
atrMultiplierStop = input.float(1.5, title="ATR Multiplier for Stop Loss")

// ADX and DMI calculations
[adx, plusDI, minusDI] = ta.dmi(adxLength, adxSmoothing)

// RSI calculations
rsi = ta.rsi(close, rsiLength)
rsiSma = ta.sma(rsi, rsiSmaLength)

// ATR calculation
atr = ta.atr(atrLength)

// Slope calculations (difference from the previous value)
adxSlope = adx - adx[1]
rsiSlope = rsi - rsi[1]

// Entry conditions
adxCondition = adx > 18 and plusDI > minusDI and adxSlope > 0
rsiCondition = rsi > rsiSma and rsiSlope > 0
rsiCross60 = ta.crossover(rsi, 60)

// Global variable for long entry
var bool longEntry = false
if (adxCondition and rsiCondition and rsiCross60)
    longEntry := true
else
    longEntry := false

// Variables for target and stop loss levels
var float entryPrice = na
var float targetLevel = na
var float stopLossLevel = na

// Strategy actions
if (longEntry)
    entryPrice := close
    targetLevel := entryPrice + atr * atrMultiplierTarget
    stopLossLevel := entryPrice - atr * atrMultiplierStop
    strategy.entry("Long", strategy.long)

if (strategy.position_size > 0)
    if (close >= targetLevel)
        strategy.close("Long", comment="Tgt Hit")
    if (close <= stopLossLevel)
        strategy.close("Long", comment="SL Hit")

// Ensure lines plot on the chart body
targetLine = strategy.position_size > 0 ? targetLevel : na
stopLossLine = strategy.position_size > 0 ? stopLossLevel : na

plot(targetLine, title="Target Level", color=color.green, linewidth=2, offset=0)
plot(stopLossLine, title="Stop Loss Level", color=color.red, linewidth=2, offset=0)

// Add entry price for reference
plot(strategy.position_size > 0 ? entryPrice : na, title="Entry Price", color=color.blue, linewidth=1, style=plot.style_cross, offset=0)