고급 이중 이동 평균 모멘텀 반전 전략: RSI 및 볼린저 밴드 협업 거래 시스템

2
Follow
478
Followers
개요
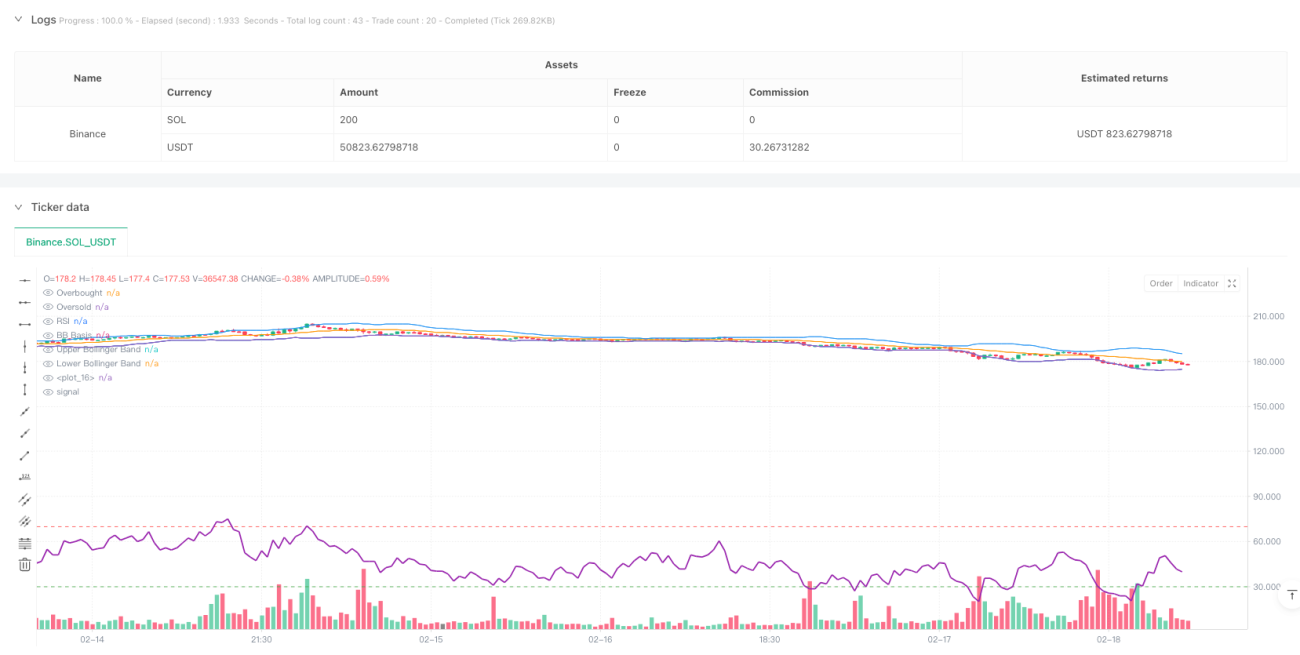
이 전략은 상대적으로 약한 지표 ((RSI) 와 부린 밴드 ((BB) 를 결합한 고급 기술 분석 거래 시스템입니다. 이 두 지표를 연동하여 시장의 과매매 과매매 영역에서 높은 확률의 역전 거래 기회를 찾습니다. 이 전략은 20주기 이동 평균을 부린 밴드의 기준으로 삼고 표준 차이의 2배로 경로를 설정하고 14주기 RSI를 사용하여 동력을 분석합니다. RSI가 30/70을 돌파하고 가격이 부린 밴드 경계에 도달하면 거래 신호를 발생시킵니다.
전략 원칙
전략의 핵심 논리는 두 가지 주요 기술 지표의 상호 작용에 기반합니다.
- 브린 띠 부분은 20주기 간단한 이동 평균을 중간 궤도로 사용하며, 상하의 궤도는 각각 중간 궤도에 2배의 표준 차이를 더하여 가격 변동 범위를 식별합니다.
- RSI 부분은 14주기 설정을 채택하고, 30은 과매도 수준으로, 70은 과매도 수준으로, 시장의 동적 상태를 판단하기 위해 사용된다.
- 여러 조건이 동시에 충족되어야 합니다: RSI가 30을 넘어서서 가격이 브린 반지하 궤도에 도달하거나 그보다 낮습니다.
- 공백 조건은 동시에 충족되어야 합니다: RSI는 70을 넘어가고 가격은 브린 반도에 도달하거나 그보다 높습니다.
- 평행 조건에는 RSI가 역극점에 돌파하거나 가격이 부린 대역 중간 궤도를 돌파하는 것이 포함됩니다.
전략적 이점
- 이중 확인 메커니즘: RSI와 브린 띠의 조합을 통해 더 신뢰할 수 있는 거래 신호를 제공합니다.
- 자기 적응력: 브린 밴드는 시장의 변동에 따라 자동으로 대역폭을 조정하여 다른 시장 환경에 적응한다.
- 위험 통제: 명확한 입출장 조건과 과도한 거래가 없도록 한다.
- 시각적 효과: 전략은 명확한 시각적 지시를 제공하여 거래자가 시장 상태를 이해하기 쉽다.
- 매개 변수 조정성: 핵심 매개 변수는 시장 특성에 따라 최적화 될 수 있다.
전략적 위험
- 불안한 시장 위험: 상반기 시장에서 빈번한 가짜 브레이크 신호가 발생할 수 있습니다.
- 트렌드 시장 위험: 강한 트렌드에서 반전 신호는 조기 평준화를 초래할 수 있다.
- 매개 변수 민감성: 다른 시장 환경에는 다른 매개 변수 설정이 필요할 수 있다.
- 슬라이드 포인트 위험: 유동성이 낮은 시장에서 실제 거래 가격은 신호 가격과 편차할 수 있다.
- 시스템적 위험: 시장의 급격한 변동으로 인해 큰 회수와 마주할 수 있다.
전략 최적화 방향
- 트렌드 필터를 추가: 트렌드 지표를 추가하여 강력한 트렌드에서 역거래를 피하십시오.
- 최적화 매개 변수 적응: 동적 매개 변수 조정 메커니즘을 개발하여 전략이 시장 변화에 더 잘 적응할 수 있도록 한다.
- 리스크 관리를 개선: 동적 스톱로스 및 수익 목표 설정 추가.
- 거래량 분석: 거래량 지표와 결합하여 신호 신뢰도를 높인다.
- 개발 시장 환경 식별: 시장 상태 분류 시스템을 구축하여 다른 시장 조건에서 다른 파라미터를 사용합니다.
요약하다
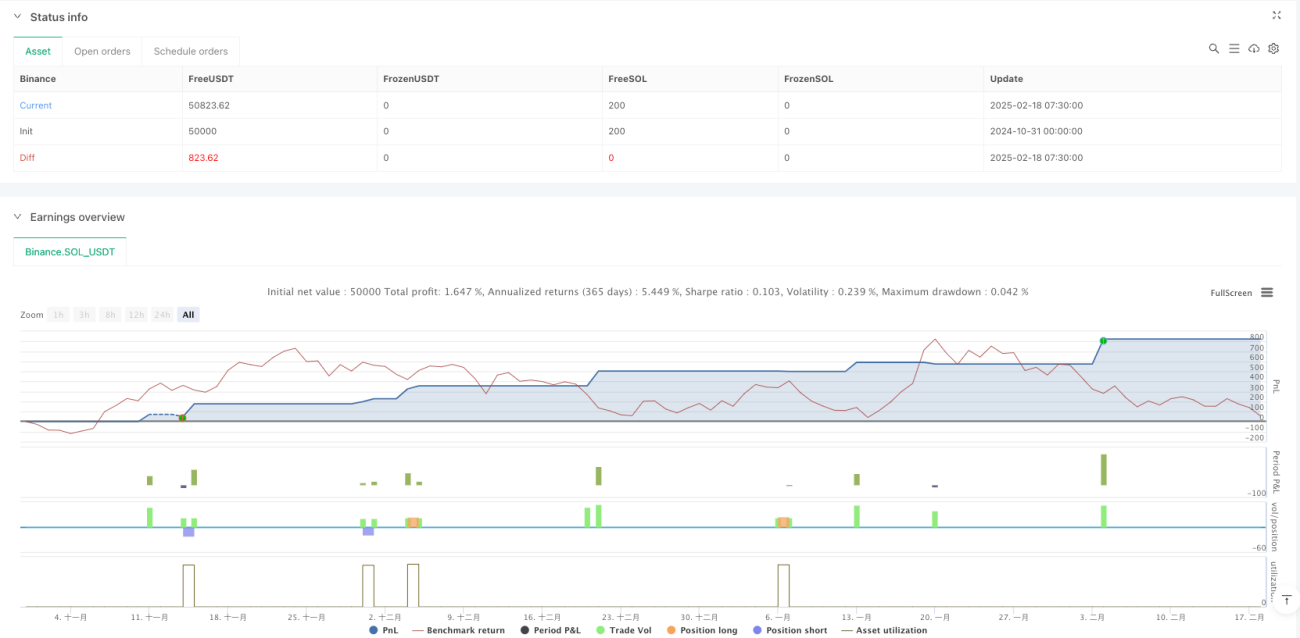
이 전략은 RSI와 브린띠의 연동 작용을 통해 완전한 거래 시스템을 구축한다. 그것은 명확한 입출입 신호를 제공할 뿐만 아니라, 좋은 위험 제어 장치도 갖추고 있다. 일부 고유한 위험이 존재하지만, 지속적인 최적화 및 개선으로 전략은 다양한 시장 환경에서 안정적인 성능을 유지할 것으로 예상된다. 전략의 모듈화 설계는 또한 미래의 최적화 및 확장을위한 좋은 토대를 제공합니다.
Source
Pine
/*backtest
start: 2024-10-31 00:00:00
end: 2025-02-18 08:00:00
period: 30m
basePeriod: 30m
exchanges: [{"eid":"Binance","currency":"SOL_USDT"}]
*/

//@version=5
strategy("RSI + Bollinger Bands Strategy", overlay=true, default_qty_type=strategy.percent_of_equity, default_qty_value=10)

// Bollinger Bands SettingsStrategy parameters
Related strategies
Comment
All comments (0)
No data
- 1