볼린저 밴드와 MACD 지표를 기반으로 한 고빈도 트레이딩 전략 분석 시스템

BB MACD SMA MA VOL
생성 날짜: 2025-02-20 10:14:14 마지막으로 수정됨: 2025-02-20 17:55:49
복사: 1 클릭수: 448
avatar of ianzeng123 ianzeng123
2
집중하다
319
수행원

볼린저 밴드와 MACD 지표를 기반으로 한 고빈도 트레이딩 전략 분석 시스템 볼린저 밴드와 MACD 지표를 기반으로 한 고빈도 트레이딩 전략 분석 시스템

개요

이것은 부린 밴드 (Bollinger Bands), 이동 평균 분산 (MACD) 및 거래량 분석을 결합한 고주파 거래 전략 시스템이다. 이 전략은 시장의 역전 기회를 포착하기 위해 부린 밴드 (Bollinger Bands), 이동 평균 분산 (MACD) 및 거래량 분석을 결합한 MACD 동력 지표와 거래량 확인을 결합하여 가격의 부진과 역전을 식별합니다. 시스템은 최대 거래 수를 제한하고 있으며, 완벽한 위험 관리 장치가 갖추어져 있습니다.

전략 원칙

이 전략은 다음과 같은 세 가지 핵심 지표의 조합을 기반으로 합니다.

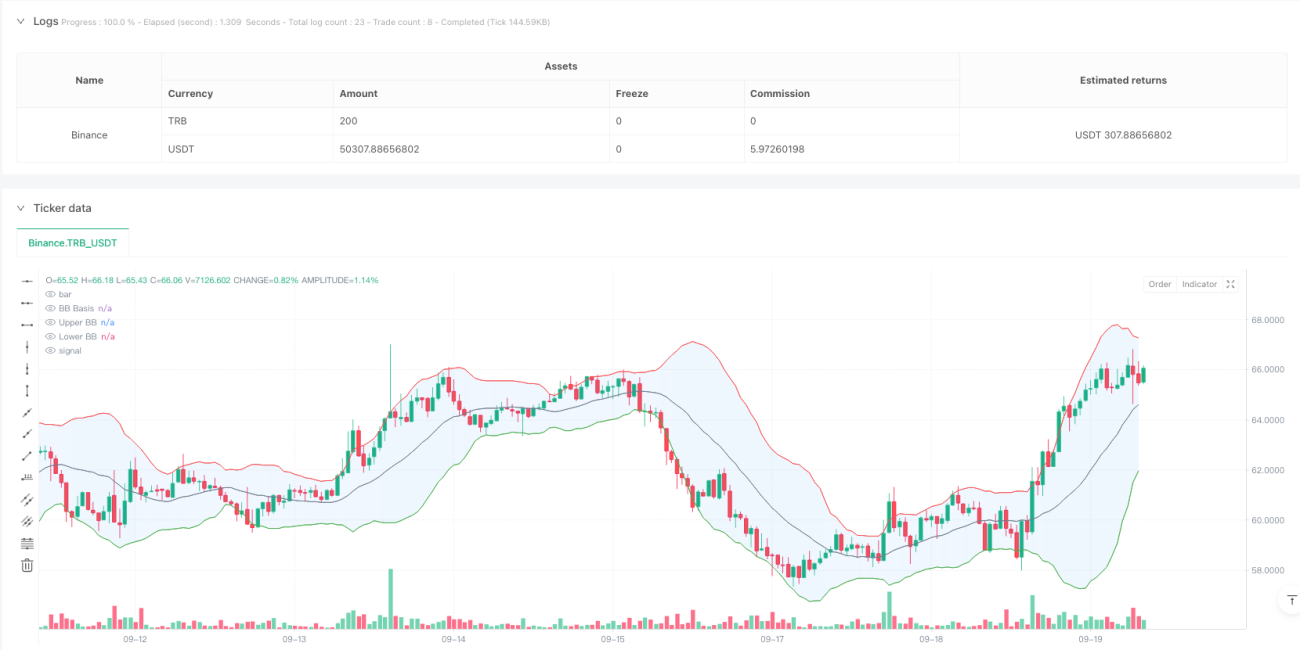
  1. 브린 밴드 지표: 20주기의 간단한 이동 평균 ((SMA) 을 중간 궤도로 사용하여, 표준 차이의 곱이 2.0으로 계산 상하 궤도. 가격이 브린 밴드를 뚫고 돌아왔을 때, 시스템은 잠재적인 거래 신호를 낸다.
  2. MACD 지표: 표준 변수 설정을 사용하여 ((12,26,9), 가격 트렌드 동력을 확인하기 위해. MACD 라인이 신호선 위에 있을 때 확인 다중 신호를 하고, 신호선 아래에 있을 때 확인 다중 신호를 한다.
  3. 거래량 분석: 20주기 이동 평균을 사용하여 거래량을 확인하고, 신호가 발생했을 때 거래량이 최소한 평균 수준에 달하도록 요구하여 시장 참여를 보장한다.

전략적 이점

  1. 다중 신호 확인: 브린 밴드, MACD 및 거래량 3차 확인을 통해 거래 신호의 신뢰성이 크게 향상되었다.
  2. 시각적 디자인: 이 시스템은 브린 밴드 채우기, 신호 표시 및 배경 색상 변화를 포함한 풍부한 차트 지시 사항을 제공하여 거래자가 거래 기회를 신속하게 식별 할 수 있도록합니다.
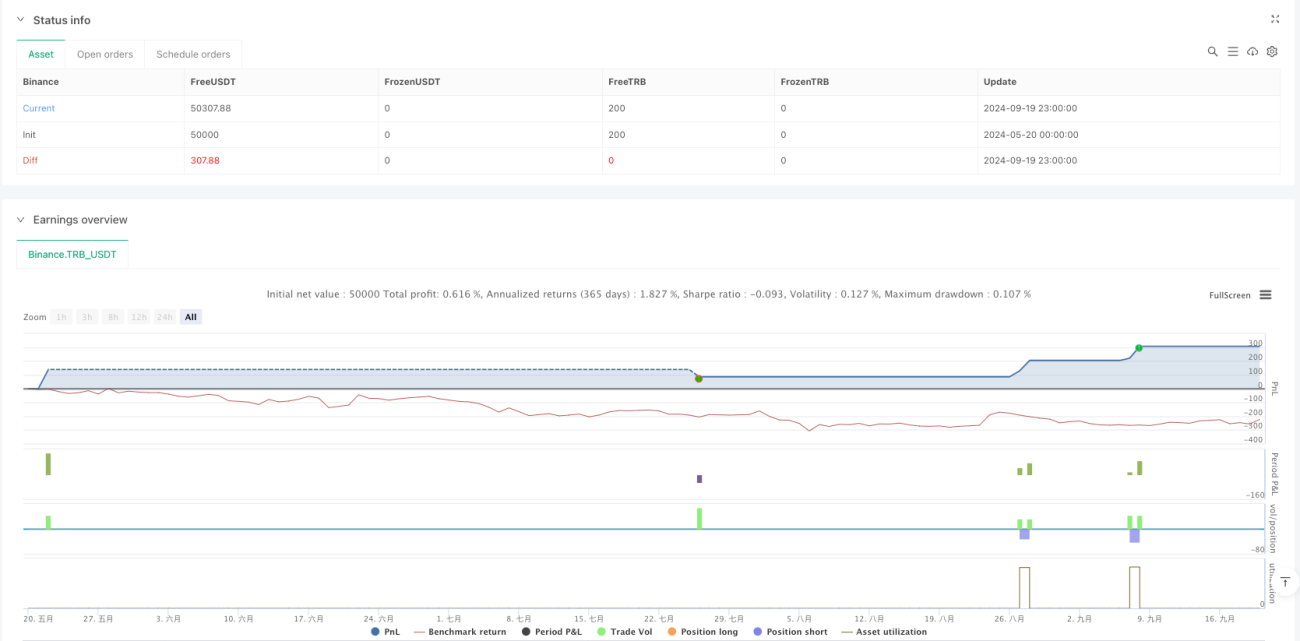
  3. 리스크 관리가 완벽합니다. 고정된 스톱로스 및 수익 목표가 적용되며, 하루에 최대 거래 횟수를 제한하여 리스크 을 효과적으로 제어합니다.
  4. 체계화 된 운영: 전략은 명확한 입출장 조건을 제공하며 주관적 판단으로 인한 불확실성을 줄입니다.

전략적 위험

  1. 시장의 변동 위험: 높은 변동 시장에서, 가짜 브레이크 신호가 발생하여 거래 손실이 발생할 수 있습니다.
  2. 슬라이드 포인트 위험: 높은 주파수 거래 환경에서는 실제 수익에 영향을 미치는 큰 슬라이드 포인트 비용에 직면 할 수 있습니다.
  3. 유동성 위험: 거래량 조건은 시장 유동성이 부족할 때 거래 기회를 제한할 수 있다.
  4. 시스템적 위험: 고정된 매개 변수 설치는 시장 조건의 급격한 변화에 적응하지 못할 수 있다.

전략 최적화 방향

  1. 매개 변수 동적 최적화: 시장 조건에 따라 브린 밴드 및 MACD 매개 변수가 자동으로 조정될 수 있도록 적응 매개 변수 조정 메커니즘을 도입할 수 있다.
  2. 시장주기 인식: 시장주기 판단 모듈을 추가하여 다른 시장주기에 따라 다른 거래 전략을 사용합니다.
  3. 위험 관리 최적화: 시장의 변동성에 따라 중지 위치를 조정하는 동적 중지 메커니즘을 도입하는 것을 고려할 수 있습니다.
  4. 신호 필터 강화: 트렌드 강도 필터를 추가하여 수평 시장에서 과도한 거래 신호를 피하십시오.

요약하다

이 전략은 브린 반향 신호, MACD 트렌드 확인 및 거래량 검증을 결합하여 전체 거래 시스템을 구축합니다. 시스템의 시각적 설계와 엄격한 위험 제어로 인해 일일 거래에 특히 적합합니다. 특정 시장 위험이 존재하지만 지속적인 최적화 및 매개 변수 조정으로 전략은 다양한 시장 환경에서 안정적인 성능을 유지할 것으로 예상됩니다.

전략 소스 코드
/*backtest
start: 2024-05-20 00:00:00
end: 2024-09-20 00:00:00
period: 1h
basePeriod: 1h
exchanges: [{"eid":"Binance","currency":"TRB_USDT"}]
*/

//@version=5
// Bollinger Bounce Reversal Strategy - Visual Edition
//
// Description:
// This strategy seeks to capture reversal moves at extreme price levels (“bounce points”) using Bollinger Bands.
// A long entry is triggered when the price, after being below the lower Bollinger Band, crosses upward above it,
// provided that the MACD line is above its signal line (indicating bullish momentum) and volume is strong.
// Conversely, a short entry is triggered when the price, after being above the upper Bollinger Band, crosses downward
// below it, with the MACD line below its signal line and high volume.
// To help avoid overtrading, the strategy limits entries to a maximum of 5 trades per day.
// Risk management is applied via fixed stop‑loss and take‑profit orders.
// This version overlays many visual cues on the chart: filled Bollinger Bands, signal markers, background colors,
// and an on‑chart information table displaying key values.
//
// Backtesting Parameters:
// • Initial Capital: $10,000  
// • Commission: 0.1% per trade  
// • Slippage: 1 tick per bar
//
// Disclaimer:
// Past performance is not indicative of future results. This strategy is experimental and provided solely for educational
// purposes. Please backtest and paper trade under your own conditions before live deployment.
//
// Author: [Your Name]
// Date: [Date]

strategy("Bollinger Bounce Reversal Strategy - Visual Edition", overlay=true, initial_capital=10000, 
     default_qty_type=strategy.percent_of_equity, default_qty_value=5, 
     commission_type=strategy.commission.percent, commission_value=0.1, slippage=1)

// ─── INPUTS ─────────────────────────────────────────────────────────────
bbPeriod        = input.int(20, "Bollinger Bands Period", minval=1)
bbStd           = input.float(2.0, "BB StdDev Multiplier", step=0.1)
macdFast        = input.int(12, "MACD Fast Length", minval=1)
macdSlow        = input.int(26, "MACD Slow Length", minval=1)
macdSignal      = input.int(9,  "MACD Signal Length", minval=1)
volAvgPeriod    = input.int(20, "Volume MA Period", minval=1)
volFactor       = input.float(1.0, "Volume Spike Factor", step=0.1)  // Volume must be >= volAvg * factor
stopLossPerc    = input.float(2.0,  "Stop Loss (%)", step=0.1) * 0.01
takeProfitPerc  = input.float(4.0,  "Take Profit (%)", step=0.1) * 0.01

// ─── CALCULATIONS ─────────────────────────────────────────────────────────
basis    = ta.sma(close, bbPeriod)
dev      = bbStd * ta.stdev(close, bbPeriod)
upperBB  = basis + dev
lowerBB  = basis - dev

[macdLine, signalLine, _] = ta.macd(close, macdFast, macdSlow, macdSignal)
volAvg   = ta.sma(volume, volAvgPeriod)

// ─── VISUALS: Bollinger Bands & Fill ───────────────────────────────────────
pBasis = plot(basis, color=color.gray, title="BB Basis")
pUpper = plot(upperBB, color=color.red, title="Upper BB")
pLower = plot(lowerBB, color=color.green, title="Lower BB")
fill(pUpper, pLower, color=color.new(color.blue, 90), title="BB Fill")

// ─── DAILY TRADE LIMIT ─────────────────────────────────────────────────────
// Reset the daily trade count at the start of each new day; limit entries to 5 per day.
var int tradesToday = 0
if ta.change(time("D"))
    tradesToday := 0

// ─── SIGNAL LOGIC ─────────────────────────────────────────────────────────
// Define a "bounce" signal:
// For a long signal, require that the previous bar was below the lower band and the current bar crosses above it,
// the MACD line is above its signal, and volume is high.
longSignal = (close[1] < lowerBB and close > lowerBB) and (macdLine > signalLine) and (volume >= volFactor * volAvg)
// For a short signal, require that the previous bar was above the upper band and the current bar crosses below it,
// the MACD line is below its signal, and volume is high.
shortSignal = (close[1] > upperBB and close < upperBB) and (macdLine < signalLine) and (volume >= volFactor * volAvg)

// Plot visual signal markers on the chart.
plotshape(longSignal, title="Long Signal", style=shape.labelup, location=location.belowbar, color=color.green, text="Long", size=size.small)
plotshape(shortSignal, title="Short Signal", style=shape.labeldown, location=location.abovebar, color=color.red, text="Short", size=size.small)

// Change background color on signal bars for an extra cue.
bgcolor(longSignal ? color.new(color.green, 80) : shortSignal ? color.new(color.red, 80) : na, title="Signal BG")

// Only enter trades if fewer than 5 have been taken today.
if longSignal and (tradesToday < 5)
    strategy.entry("Long", strategy.long)
    tradesToday += 1

if shortSignal and (tradesToday < 5)
    strategy.entry("Short", strategy.short)
    tradesToday += 1

// ─── RISK MANAGEMENT: STOP-LOSS & TAKE-PROFIT ─────────────────────────────
// For long positions: set stop loss and take profit relative to the entry price.
if strategy.position_size > 0
    strategy.exit("Long Exit", "Long", stop=strategy.position_avg_price*(1 - stopLossPerc), limit=strategy.position_avg_price*(1 + takeProfitPerc))
// For short positions: set stop loss and take profit relative to the entry price.
if strategy.position_size < 0
    strategy.exit("Short Exit", "Short", stop=strategy.position_avg_price*(1 + stopLossPerc), limit=strategy.position_avg_price*(1 - takeProfitPerc))