다중 지표 통합 일중 양적 거래 전략: VWAP-Fibonacci-RSI-SMA 기반 동적 신호 시스템

2
Follow
478
Followers
개요
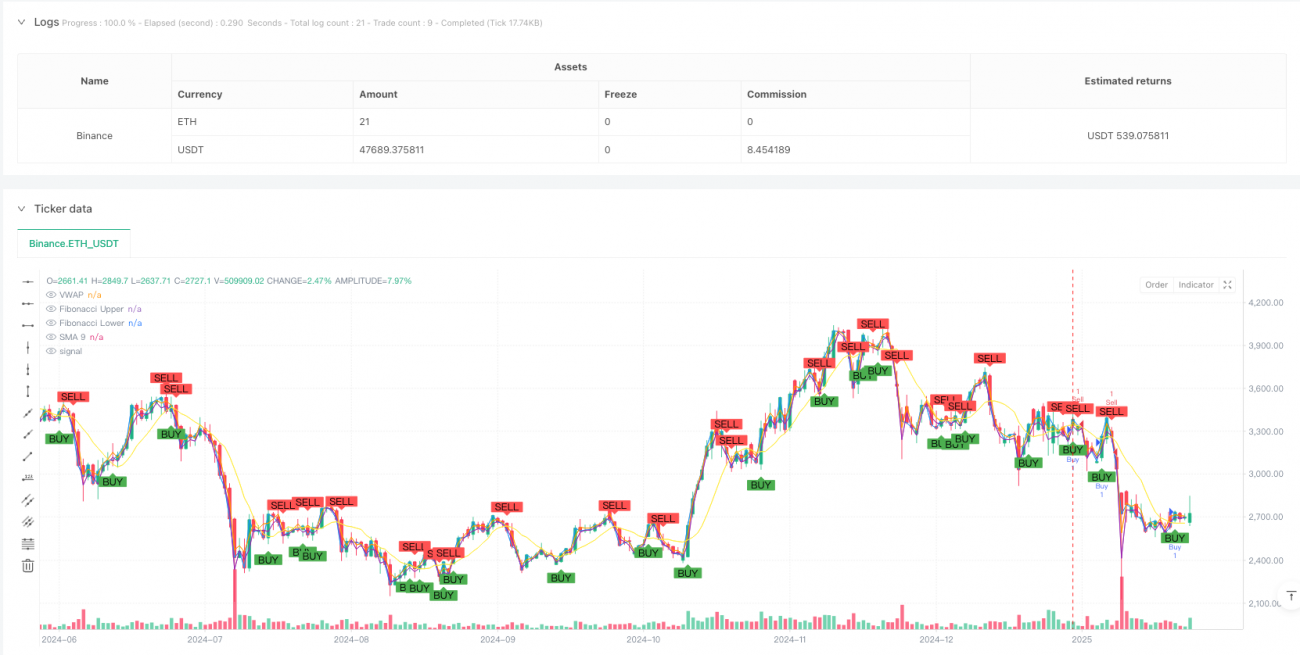
이 전략은 여러 기술 지표를 유기적으로 결합한 일일 양적 거래 전략으로, 거래량 가중 평균 ((VWAP), 피보나치 리코딩 레벨, 상대적으로 약한 지표 ((RSI) 및 간단한 이동 평균 ((SMA) 을 통합하여 다차원 거래 신호 시스템을 구축합니다. 이 전략은 다른 지표에 대한 조화를 통해 시장의 변동에서 높은 확률의 거래 기회를 찾습니다.
전략 원칙
이 전략은 거래 신호를 확인하기 위해 여러 계층의 필터링 메커니즘을 사용합니다.
- RSI 지표를 사용하여 오버 바이 오버 세 영역을 식별합니다. RSI가 30을 넘어서서 오버 세 영역으로 들어가면 구매 신호를 생성하고 70을 넘어서서 오버 바이 영역으로 들어가면 판매 신호를 생성합니다.
- 피보나치 회귀 레벨 (.382 및 0.618) 을 통해 가격 운동의 참조 범위를 설정하고, 가격이 이 범위에 있을 때만 거래가 허용됩니다.
- VWAP를 트렌드 확인 지표로 사용하여, VWAP 위쪽은 지지율이 높고, 아래쪽은 지지율이 낮습니다.
- SMA를 보조 지표로 도입하여 가격이 SMA를 돌파하면 추가 거래 신호를 생성합니다.
최종 거래 신호는 RSI 조건 또는 SMA 조건을 충족해야 하며, 피보나치 범위 및 VWAP 위치 요구 사항에 부합한다.
전략적 이점
- 다중 신호 확인 메커니즘은 거래의 신뢰성을 크게 향상시키고 가짜 신호의 영향을 줄입니다.
- 트렌드와 흔들림의 두 가지 거래 방식을 결합하여 트렌드 기회를 잡을 수 있으며, 간격 거래를 할 수 있습니다.
- VWAP의 도입을 통해 거래량 요소를 고려하여 전략이 실제 시장 상황에 더 가깝게됩니다.
- 피보나치 회귀 레벨의 적용은 중요한 가격 영역을 확인하는 데 도움이 되며, 진입 시기의 정확성을 향상시킵니다.
- 명확한 전략 논리, 각 지표의 역할, 모니터링 및 조정 용이함
전략적 위험
- 다중 조건으로 인해 거래 기회를 놓칠 수 있습니다. 특히 급속한 거래에서
- RSI와 SMA는 급격한 변동 시장에서 지연 신호를 줄 수 있습니다.
- 피보나치 회귀 간격의 계산은 역사적 데이터에 의존하며 시장 환경이 크게 변할 때 유효하지 않을 수 있습니다.
- VWAP의 참조 의미는 다른 시간대에서 차이가 있을 수 있다
- 위험을 통제하기 위해 합리적인 스톱 손실 설정이 필요하며, 급격한 변동에서 과도한 손실을 피합니다.
전략 최적화 방향
- 시장의 변동 상황에 따라 각 지표의 매개 변수를 조정하는 적응 가능한 매개 변수 최적화 메커니즘을 도입합니다.
- 거래량 분석 차원을 추가하고 VWAP 기반의 거래량 비정상성을 추가합니다
- 시장의 변동성 지표를 추가하는 것을 고려하고, 다양한 변동성 환경에서 전략을 급격히 조정하는 정도
- 역동적인 상쇄를 고려할 수 있는 상쇄장치의 개선
- 거래 시간 필터를 추가하여 다른 기간의 시장 특성을 식별합니다.
요약하다
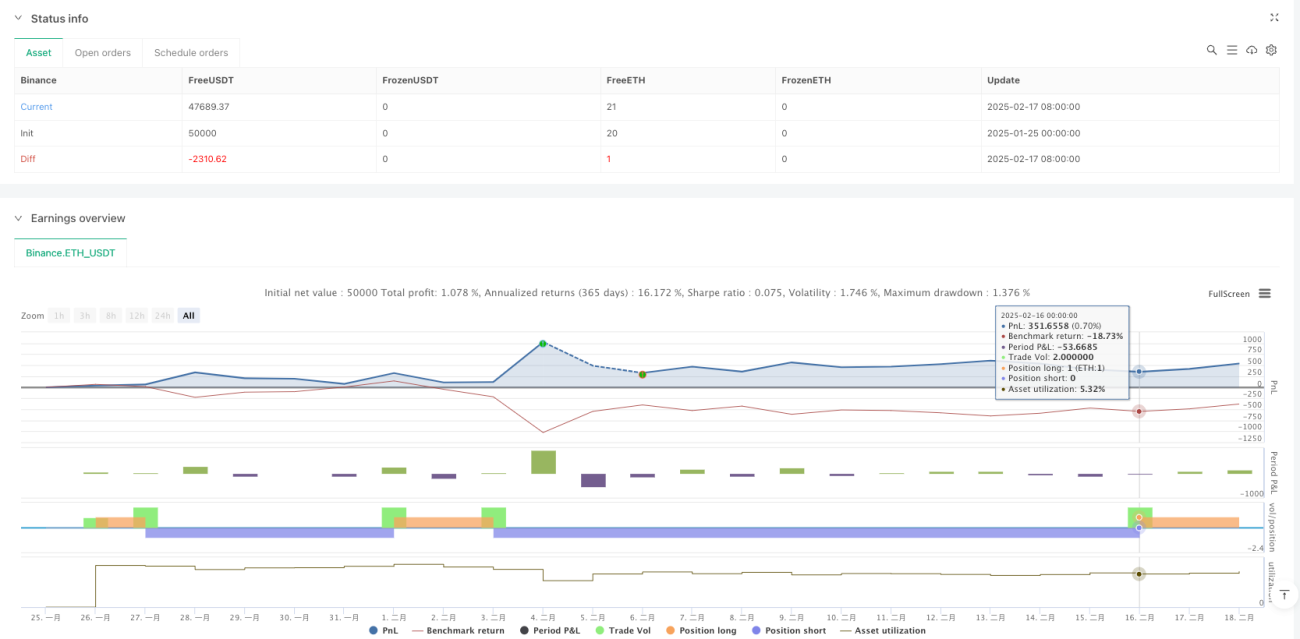
이것은 포괄적 인, 논리적으로 엄격한 일일 거래 전략이다. 여러 기술 지표의 연동 작용을 통해 위험을 제어하면서 안정적인 수익을 추구한다. 전략은 강력한 실용성과 확장성을 가지고 있으며, 합리적인 매개 변수 최적화 및 위험 통제를 통해 다양한 시장 환경에 적응할 수 있다. 그러나 사용자는 각 지표의 특성을 깊이 이해하고, 매개 변수를 합리적으로 설정하고, 항상 위험 통제에 주의를 기울여야 한다.
Source
Pine
Strategy parameters
Related strategies
Comment
All comments (0)
No data
- 1