개요
이 전략은 기술 분석을 기반으로 한 통합 거래 시스템으로, 지지 저항 영역, 도표 형태 및 시장 구조 분석을 결합합니다. 전략은 중요한 가격 수준을 식별하고, 도표 신호를 확인하고, 전체 시장 추세를 평가하여 거래 결정을 내립니다. 이 시스템은 1:3의 위험 수익 비율을 채택하여 미리 설정된 중지 손실과 수익 목표를 통해 위험을 관리합니다.
전략 원칙
이 전략의 핵심 논리는 다음과 같은 몇 가지 핵심 요소에 기반합니다.
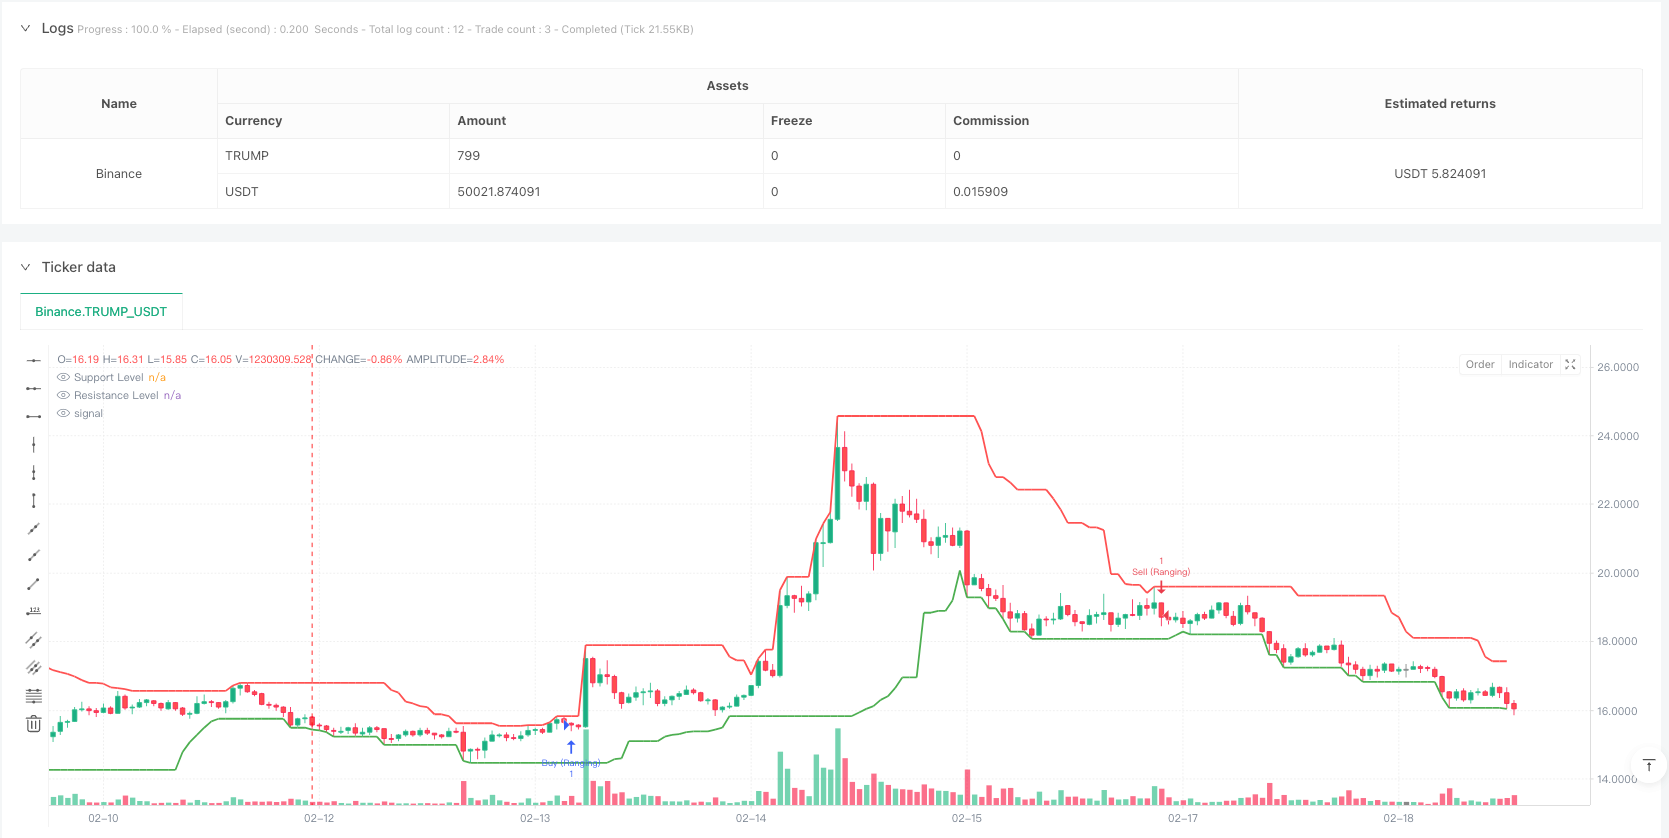
- 지원 저항 영역 식별 - 지난 20 회 동안의 최고 가격과 최저 가격을 사용하여 중요한 가격 수준을 결정합니다.
- 그래프 형태 확인 - 삼킨, 삼킨, 선 및 유성 선과 같은 전형적인 형태를 포함한다
- 시장 구조 분석 - 시장이 상승 추세, 하락 추세 또는 간격적인 흔들림을 판단하기 위해 높은 점과 낮은 점의 연속을 비교합니다.
- 위험 관리 - 고정된 스톱로스 포인트와 1:3의 리스크/이익 비율을 사용하여 스톱 포지션을 설정
전략은 세 가지 시장 환경에서 작동합니다: 트렌드 시장, 간격 시장 및 전환 시장, 그러나 각 환경에 대해 다른 거래 규칙의 조합을 사용합니다.
전략적 이점
- 다차원 분석 - 가격 수준, 그래프 형태 및 시장 구조를 통합하여 더 신뢰할 수 있는 거래 신호를 제공합니다.
- 적응력 - 트렌드 및 범위를 포함한 다양한 시장 환경에 적응할 수 있습니다.
- 리스크 관리가 잘 이루어져 있습니다. 고정된 리스크/이익 비율을 적용하여 모든 거래에 대해 명확한 리스크 관리가 보장됩니다.
- 시각적 지원 - 그래픽 상표로 저항 영역을 지원하여 거래자가 시장 상태를 이해할 수 있도록 지원
전략적 위험
- 가짜 돌파 위험 - 가격이 돌파 후에 빠르게 물러나서 가짜 신호를 생성할 수 있습니다.
- 슬라이드 포인트 위험 - 급격한 변동 기간 동안 실제 거래 가격은 예상보다 크게 오차 할 수 있습니다.
- 변수 감수성 - 저항 주기, 시장 구조 주기 등의 변수를 선택하면 전략의 성과에 중요한 영향을 미칩니다.
- 시장 환경 의존성 - 급격한 일방적인 움직임이나 극심한 변동 시장에서 좋지 않은 성과를 낼 수 있습니다.
전략 최적화 방향
- 동적 변수 조정 - 시장의 변동에 따라 자동으로 조정되는 지원 저항 영역의 계산 주기
- 필터 강화 - 가짜 돌파 신호를 필터링하기 위해 트래픽, 변동률 등의 지표를 추가
- 스톱 로즈 최적화 - ATR 기반의 동적 스톱 로즈 설정을 구현하여 시장의 변동에 대한 적응력을 향상시킵니다.
- 시간 프레임 검증 - 여러 시간 프레임 분석을 도입하여 신호의 신뢰성을 향상시킵니다.
- 포지션 관리 최적화 - 시장의 변동성과 신호 강도에 따라 포지션 규모를 동적으로 조정합니다.
요약하다
이 전략은 여러 가지 기술적 분석 도구를 통합하여 전체적인 거래 시스템을 구축합니다. 이 전략은 다차원 분석과 완벽한 위험 관리의 장점을 가지고 있지만, 가짜 돌파구 및 변수 민감성 등의 과제에 직면합니다. 제안된 최적화 방향을 통해 전략은 기존의 장점을 유지하면서 안정성과 적응력을 더욱 향상시킬 수 있습니다. 이 전략을 성공적으로 적용하려면 거래자는 각 구성 요소를 깊이 이해하고 실제 시장 상황에 따라 적절한 변수를 조정해야합니다.
전략 소스 코드
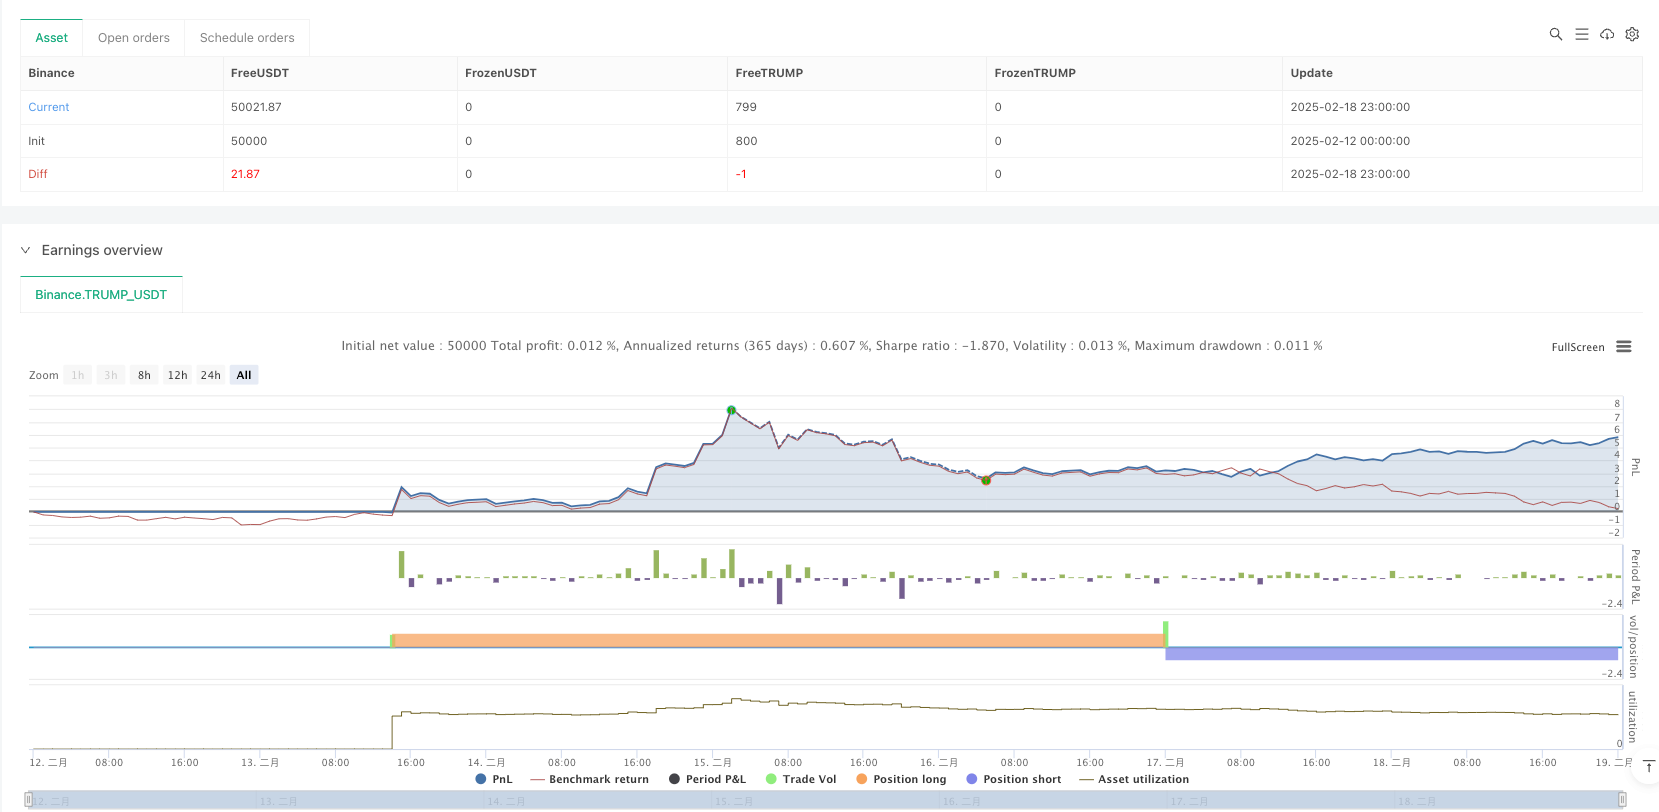
/*backtest
start: 2025-02-12 00:00:00
end: 2025-02-19 00:00:00
period: 1h
basePeriod: 1h
exchanges: [{"eid":"Binance","currency":"TRUMP_USDT"}]
*/

//@version=5
strategy("Support/Resistance Strategy with Candlestick Confirmation, Market Structure, and 1:3 R:R", overlay=true)

// Input parameters
supportResistancePeriod = input.int(20, title="Support/Resistance Period", minval=1)
stopLossPips = input.int(50, title="Stop Loss (in pips)", minval=1)
takeProfitRatio = input.float(3.0, title="Risk-to-Reward Ratio", minval=1.0)
structurePeriod = input.int(20, title="Market Structure Period", minval=1)  // Period to determine market structure

// Function to calculate support level (lowest low in the period)
getSupportLevel() =>
    ta.lowest(low, supportResistancePeriod)

// Function to calculate resistance level (highest high in the period)
getResistanceLevel() =>
    ta.highest(high, supportResistancePeriod)

// Get the support and resistance levels
supportLevel = getSupportLevel()
resistanceLevel = getResistanceLevel()

// Function to detect market structure
isBullishTrend() =>
    high[structurePeriod] > high[structurePeriod+1] and low[structurePeriod] > low[structurePeriod+1]

isBearishTrend() =>
    high[structurePeriod] < high[structurePeriod+1] and low[structurePeriod] < low[structurePeriod+1]

isRanging() =>
    not isBullishTrend() and not isBearishTrend()

// Candlestick Pattern Detection Functions
isBullishEngulfing() =>
    close[1] < open[1] and close > open and close > open[1] and open < close[1]

isBearishEngulfing() =>
    close[1] > open[1] and close < open and close < open[1] and open > close[1]

isDoji() =>
    math.abs(close - open) <= (high - low) * 0.1

isHammer() =>
    body = math.abs(close - open)
    upperShadow = high - math.max(close, open)
    lowerShadow = math.min(close, open) - low
    body <= (high - low) * 0.3 and lowerShadow > body * 2 and upperShadow <= body * 0.5

isShootingStar() =>
    body = math.abs(close - open)
    upperShadow = high - math.max(close, open)
    lowerShadow = math.min(close, open) - low
    body <= (high - low) * 0.3 and upperShadow > body * 2 and lowerShadow <= body * 0.5

// Conditions for Buy and Sell based on candle close
buyCondition = (isBullishEngulfing() or isHammer()) and close > supportLevel
sellCondition = (isBearishEngulfing() or isShootingStar()) and close < resistanceLevel

// Define buy/sell conditions based on market structure
bullishMarket = isBullishTrend() and buyCondition
bearishMarket = isBearishTrend() and sellCondition
rangingMarket = isRanging() and (buyCondition or sellCondition)

// Calculate the Stop Loss and Take Profit Levels
longStopLoss = supportLevel - (stopLossPips * syminfo.mintick)
shortStopLoss = resistanceLevel + (stopLossPips * syminfo.mintick)

// Calculate R:R based Take Profit Levels
longTakeProfit = close + (math.abs(close - longStopLoss) * takeProfitRatio)
shortTakeProfit = close - (math.abs(close - shortStopLoss) * takeProfitRatio)

// Plotting Support and Resistance Lines
plot(supportLevel, color=color.green, linewidth=2, title="Support Level", style=plot.style_line)
plot(resistanceLevel, color=color.red, linewidth=2, title="Resistance Level", style=plot.style_line)

// Strategy: Buy on Support, Sell on Resistance with candlestick confirmation and market structure
if (bullishMarket)
    strategy.entry("Buy", strategy.long, stop=longStopLoss, limit=longTakeProfit)

if (bearishMarket)
    strategy.entry("Sell", strategy.short, stop=shortStopLoss, limit=shortTakeProfit)

if (rangingMarket)
    if (buyCondition)
        strategy.entry("Buy (Ranging)", strategy.long, stop=longStopLoss, limit=longTakeProfit)
    if (sellCondition)
        strategy.entry("Sell (Ranging)", strategy.short, stop=shortStopLoss, limit=shortTakeProfit)

// Optional: Highlighting the zones for support and resistance
bgcolor(close > resistanceLevel ? color.new(color.red, 90) : na, title="Resistance Zone")
bgcolor(close < supportLevel ? color.new(color.green, 90) : na, title="Support Zone")