가우시안 채널 추세 추종 및 확률적 RSI 거래 전략

2
Follow
478
Followers
개요
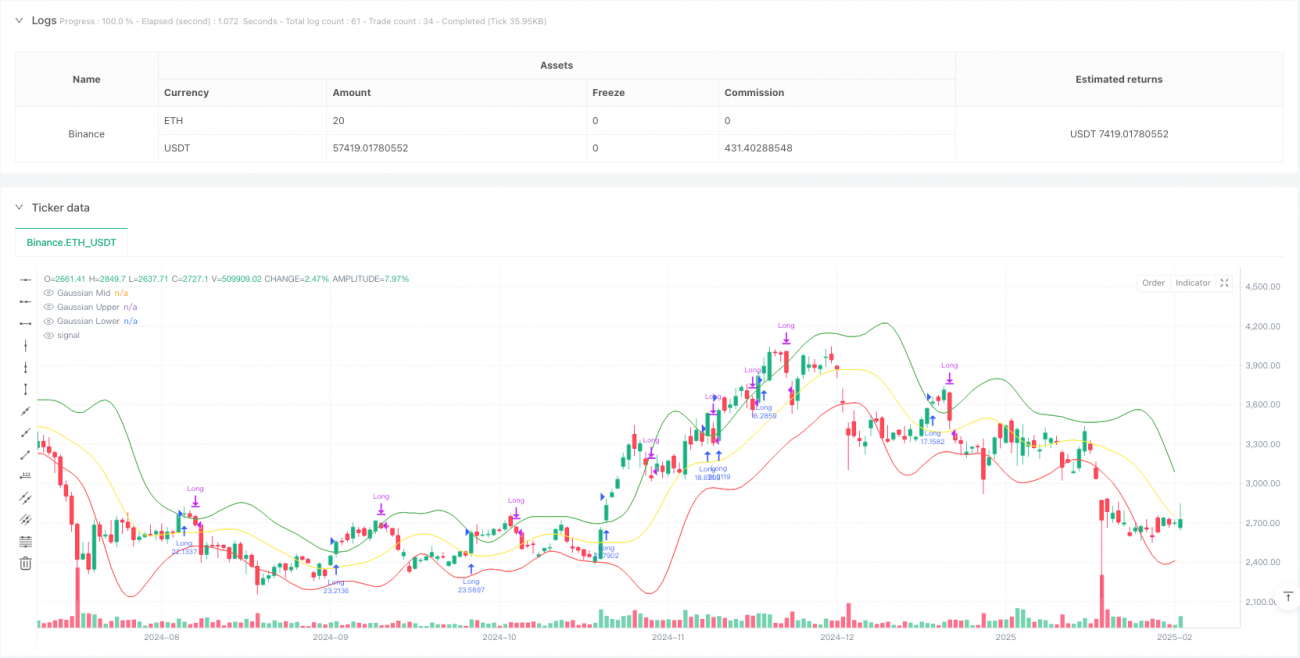
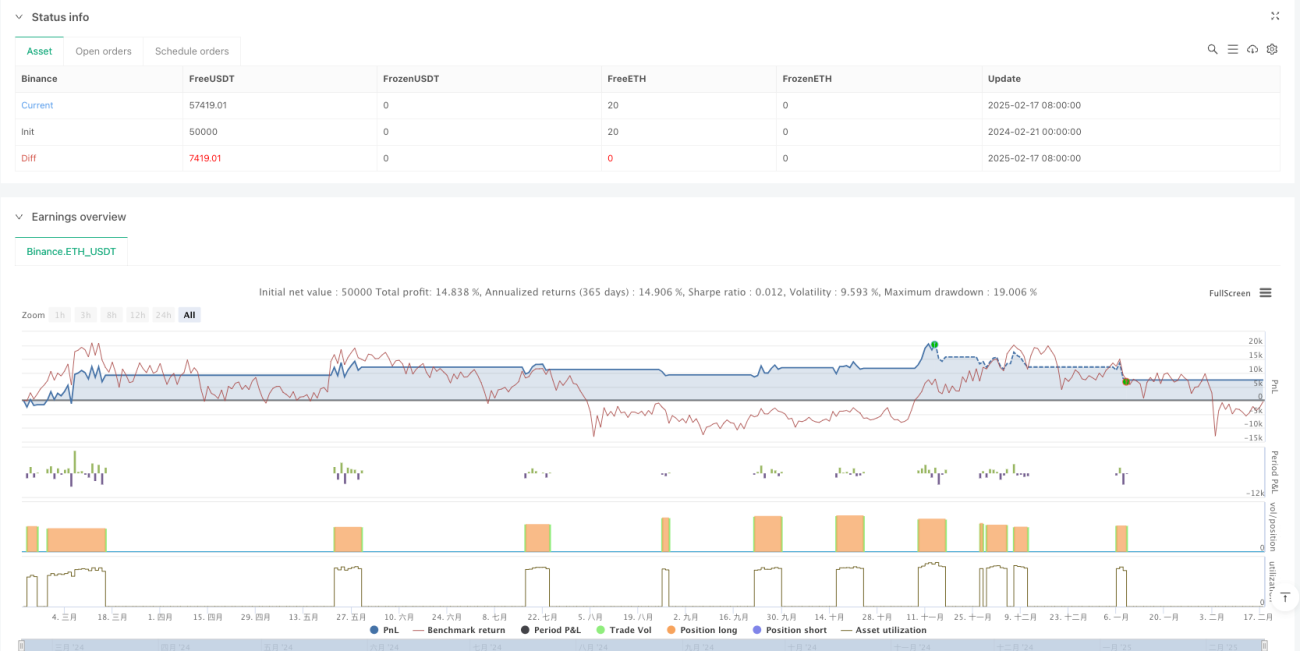
이 전략은 고스카 가중 이동 평균 채널과 무작위 상대적으로 약한 지수 (Stochastic RSI) 를 결합한 트렌드 추적 거래 시스템이다. 이 전략은 고스카 가중 방식에 의해 가격 채널을 구축하고, 무작위 RSI 지표의 교차 신호와 결합하여 입문 및 출구 시기를 결정하여 트렌드를 파악하고 동력을 확인한다. 이 전략은 좋은 수학 기반을 가지고 있으며, 시장 소음을 효과적으로 필터링하여 주요 트렌드를 포착할 수 있다.
전략 원칙
이 전략의 핵심 논리는 크게 두 가지로 이루어져 있습니다.
-
고스 통로 시스템: 고스 가중 이동 평균 ((GWMA) 와 고스 가중 표준 차 ((GWSD) 를 사용하여 가격 통로를 구성한다. GWMA는 최근의 데이터에 더 큰 무게를 부여하고, 평행선이 가격 변화에 대한 반응에 더 민감하게 만든다.
-
무작위 RSI 시스템: 전통적인 RSI 지표를 무작위적으로 처리하여 K값과 D값을 계산한다. 이 처리 방식은 오버 바이 오버 셀 영역을 더 잘 식별하여 더 정확한 동력 신호를 제공합니다.
거래 신호는 다음과 같은 조건에 의해 생성됩니다.
- 더 많은 입구: 가격 폐쇄 가격 고스 통로를 돌파하고 무작위 RSI의 K 라인에서 D 라인을 통과
- 평지 신호: 코스피가 고스카스 통로를 넘어 종전
전략적 이점
- 수학적인 기초가 튼튼하다: 가스카 가중식 방식을 사용하여 가격 통로를 구성하고, 단순한 이동 평균에 비해 더 나은 이론적 기초를 가지고 있다.
- 신호 신뢰성: 가격 돌파구와 동력 확인을 결합한 이중 검증 메커니즘은 가짜 신호를 효과적으로 감소시킬 수 있다.
- 자기 적응력: 고스 가중치 방법은 시장의 변동에 따라 채널 폭을 자동으로 조정할 수 있다.
- 위험 통제: 재원 관리 및 수수료 설정으로 거래 비용과 위험을 효과적으로 제어합니다.
전략적 위험
- 트렌드 의존성: 불안정한 시장에서 빈번하게 잘못된 신호가 발생하여 과도한 거래가 발생할 수 있습니다.
- 지연 효과: 다중 평균선 평준화가 사용됨에 따라 트렌드 전환점에서 신호 지연이 발생할 수 있다.
- 매개 변수 민감성: 매개 변수 설정에 의해 전략 효과에 큰 영향을 미치며, 각 매개 변수를 신중하게 최적화해야 한다.
전략 최적화 방향
- 시장 환경 인식: 시장 환경 판단 메커니즘을 추가하여 다른 시장 상태에서 다른 파라미터 설정을 사용합니다.
- 스톱 로즈 최적화: ATR 또는 변동률에 기반한 적응 스톱 로즈와 같은 동적 스톱 메커니즘을 도입한다.
- 신호 필터링: 거래량 확인이나 다른 기술 지표를 보조 필터링 조건으로 추가한다.
- 자금 관리: 더 유연한 포지션 관리 전략을 구현하고, 신호 강도에 따라 포지션 비율을 동적으로 조정한다.
요약하다
이 전략은 고스 통로와 무작위 RSI 지표를 결합하여 견고한 수학 기반의 트렌드 추적 시스템을 구축한다. 전략은 트렌드가 뚜렷한 시장에서 우수한 성능을 발휘하지만, 매개 변수 최적화 및 시장 환경에 대한 적응성에 주의를 기울여야 한다. 권장된 최적화 조치를 실행함으로써 전략의 안정성과 수익성을 더욱 향상시킬 수 있다.
Source
Pine
/*backtest
start: 2024-02-21 00:00:00
end: 2025-02-18 08:00:00
period: 1d
basePeriod: 1d
exchanges: [{"eid":"Binance","currency":"ETH_USDT"}]
*/

//@version=5
strategy("Gaussian Channel + Stoch RSI Strategy", overlay=true, margin_long=100, margin_short=100, initial_capital=100000, commission_type=strategy.commission.percent, commission_value=0.1, default_qty_type=strategy.percent_of_equity, default_qty_value=100, pyramiding=1)

// User InputsStrategy parameters
Related strategies
Comment
All comments (0)
No data
- 1