
2
Follow
478
Followers
개요
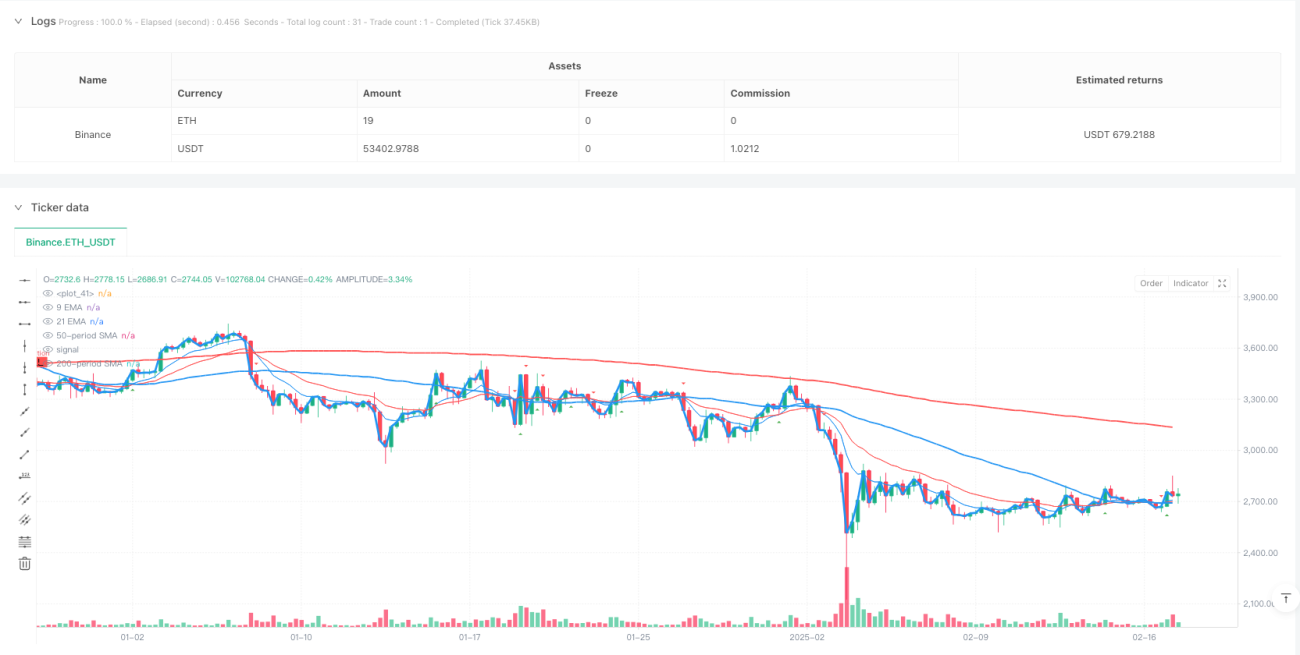
이 전략은 다중 평균선 조합에 기반한 트렌드 역전 거래 시스템으로, 9주기, 21주기, 50주기, 200주기 이동 평균을 결합하여, 평균선 교차 신호를 식별하여 시장 추세의 전환점을 포착합니다. 이 전략은 단기 및 장기 평균선의 장점을 통합하여 시장 동력의 변화를 적시에 포착하고, 가짜 신호를 효과적으로 필터링합니다.
전략 원칙
전략의 핵심 논리는 여러 시간 프레임의 평선 교차 시스템 위에 세워져 있다. 구체적으로:
- 50주기 및 200주기 간단한 이동 평균 ((SMA) 을 주요 경향 판단 지표로 사용
- 9주기 및 21주기 지수 이동 평균 ((EMA) 을 사용하여 단기 신호 확인
- 회귀기 (lookback) 및 임계 (threshold) 파라미터를 설정하여 신호 품질을 최적화합니다.
- 핵심 가격 지지점과 저항점의 판단과 함께 데이터 투명성 알고리즘을 통해 중요한 가격 수준을 식별합니다.
단기평균선이 장기평균선을 상향으로 가로지르면, 시스템은 다중 신호를 발산한다; 반대로 공백 신호를 발산한다.
전략적 이점
- 신호 시스템의 신뢰성: 여러 평행선의 교차 확인을 통해 가짜 신호의 위험을 현저히 감소시킨다.
- 트렌드 파악의 시기적절성: 단기평균선의 도입으로 시장 변화에 신속하게 대응할 수 있다.
- 위험 제어의 포괄성: 지지점과 저항점의 인식은 상쇄 중지 위치를 합리적으로 설정하는 데 도움이됩니다.
- 매개 변수 최적화 유연성: 회수 기간 및 하락 매개 변수는 시장 환경에 따라 조정할 수 있습니다.
- 시각화 효과의 직관성: 시스템은 거래 결정을 돕기 위해 명확한 그래픽 인터페이스를 제공합니다.
전략적 위험
- 위기 시장 위험: 수평 정리 단계에서 빈번하게 잘못된 신호가 발생할 수 있습니다.
- 뒤떨어진 위험: 이동 평균은 본질적으로 뒤떨어진 지표이며, 최고의 진입 시기를 놓칠 수 있습니다.
- 매개변수 민감도: 매개변수 조합이 다양하면 전략 성능에 큰 차이가 생길 수 있습니다.
- 시장 환경 의존성: 전략이 트렌드가 뚜렷한 시장에서 더 잘 작동하고, 격렬한 변동이 있을 때 더 잘 작동하지 않을 수 있습니다.
전략 최적화 방향
- 입수량 지표: 교역량을 신호 확인의 보조 지표로 고려
- 최적화된 신호 필터링: 신호가 일정 시간 동안 지속되는 것을 요구하는 더 엄격한 신호 확인 메커니즘을 설계한다
- 동적 변수 조정: 시장 상태에 따라 변수를 자동으로 조정하는 적응 변수 시스템을 개발
- 리스크 관리를 개선: 동적 손실을 방지하고, 이미 수익을 보호한다.
- 시장 환경 판단에 참여: 변동률 지표와 결합하여 다른 시장 환경에서 다른 파라미터 설정을 사용합니다.
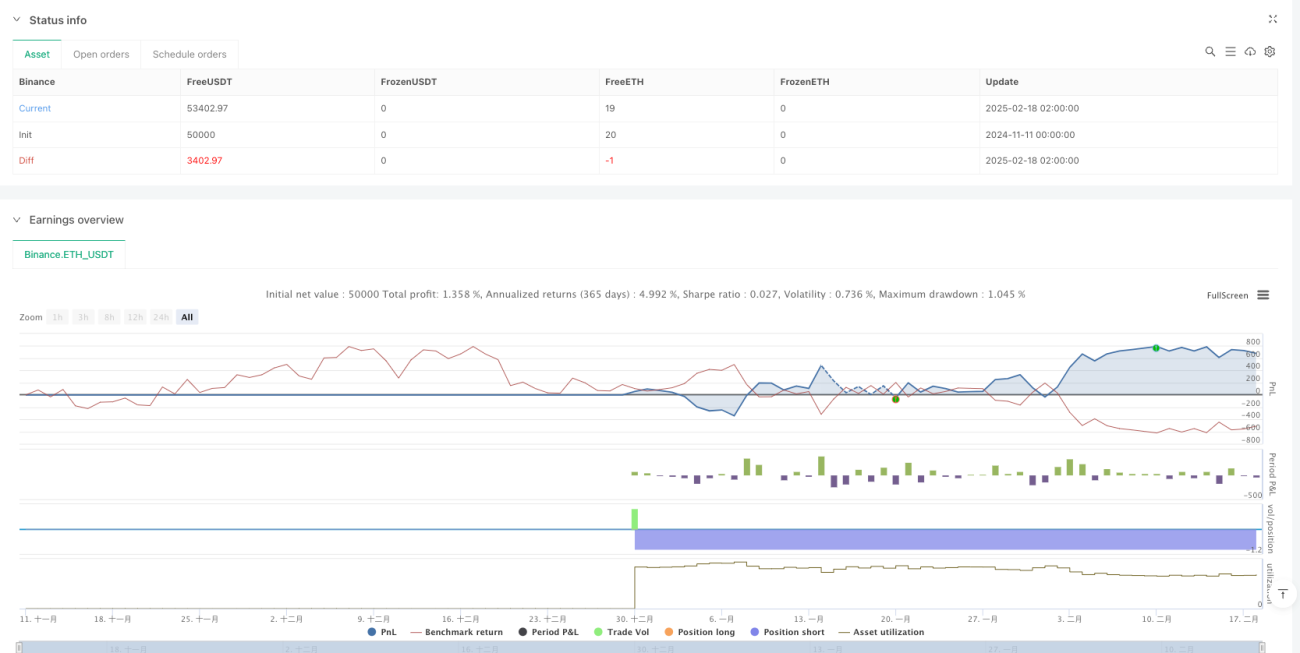
요약하다
이 전략은 다중 동선 시스템의 연동 작용을 통해 시장 추세 전환점을 효과적으로 식별합니다. 전략 설계는 실용성과 가동성에 중점을 두고 있으며, 매개 변수의 유연한 조정으로 다양한 시장 환경에 적응 할 수 있습니다.
Source
Pine
Strategy parameters
Related strategies
Comment
All comments (0)
No data
- 1