다중 기간 추세 추적 및 볼륨 확인 전략

2
Follow
478
Followers
개요
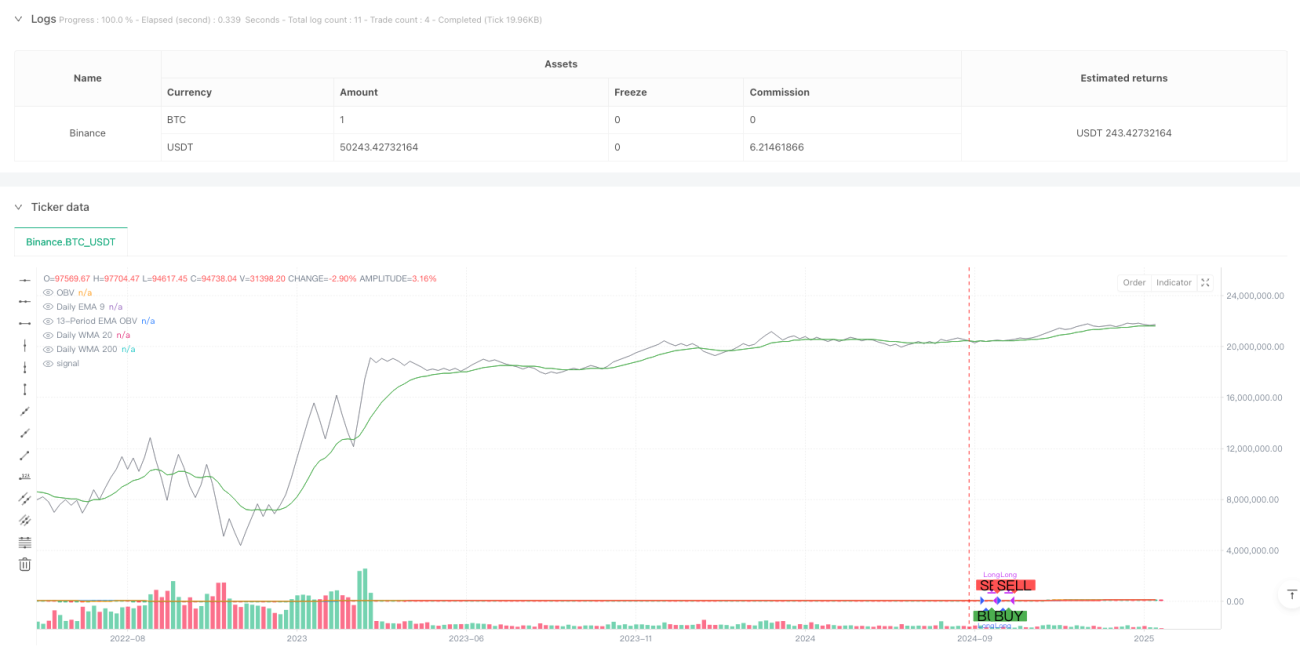
이 전략은 다중 주기 이동 평균과 거래량 분석을 결합한 트렌드 추적 시스템이다. 전략은 일계 주기의 EMA9, WMA20, WMA200 세 개의 평균선을 통해 전체적인 트렌드를 확인하고, OBV (On Balance Volume) 지표와 EMA를 도입하여 거래량을 확인하고, 보다 안정적인 트렌드 추적 거래를 실현한다.
전략 원칙
이 전략은 두 가지 핵심 조건에 기반합니다.
- 트렌드 확인 - 세 개의 일선 평균선 (EMA9, WMA20, WMA200) 이 모두 상승 상태에 있는지 판단하여 트렌드 방향을 확인합니다. 세 개의 평균선이 모두 위로 기울어지면 각 시간 주기마다 다목적 경향을 나타냅니다.
- 거래량 확인 - OBV 지표와 13주기 EMA를 사용하여 거래량 분석. OBV의 EMA가 OBV 위에있을 때, 거래량이 가격 상승을 지원하고, 트렌드의 유효성을 확인합니다.
이 두 조건이 동시에 충족될 때만, 전략은 다중 신호를 생성한다. 어느 조건이 충족되지 않을 때, 전략은 평형으로 퇴출한다.
전략적 이점
- 다중 시간 프레임 분석 - 단기 (EMA9), 중기 (WMA20) 및 장기 (WMA200) 트렌드를 종합적으로 고려하여 허위 돌파의 위험을 줄입니다.
- 거래량 지원 - OBV 지표 분석을 도입하여 가격 움직임이 거래량 지원으로 보장됩니다.
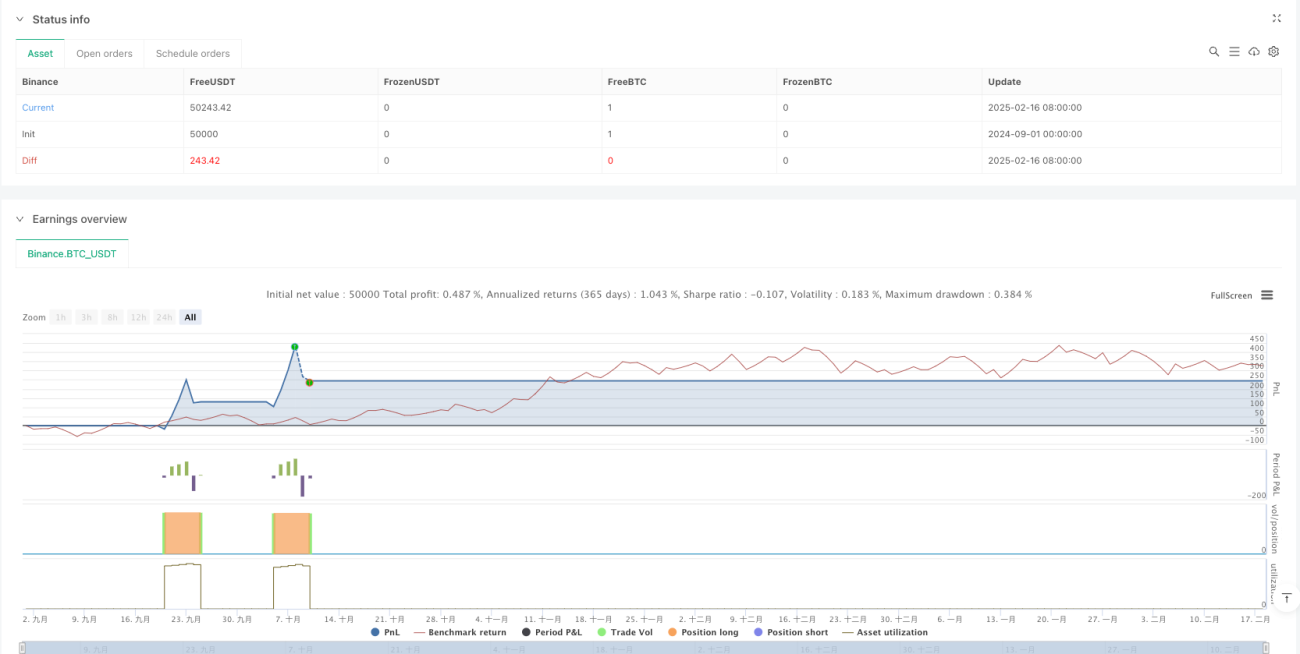
- 리스크 관리가 완벽하다 - 지분 관리와 수수료를 고려하여 실제 거래 환경에 더 적합하다.
- 시각적 지원 - 명확한 그래픽 표시를 통해 거래자가 입출시와 출출시기를 이해하도록 도와줍니다.
전략적 위험
- 트렌드 반전의 지연 - 여러 평행선 확인이 사용됨에 따라 트렌드 반전의 초기에는 반응이 느릴 수 있다.
- 흔들리는 시장은 적용되지 않습니다 - 수평 정리 단계에서 빈번한 가짜 돌파가 과도한 거래로 이어질 수 있습니다.
- 자본 비용 고려 - 0.1%의 수수료가 고주파 거래에서 수익에 상당한 영향을 미칠 수 있다.
전략 최적화 방향
- 변동률 지표 도입 - ATR과 같은 변동률 지표를 추가하여 다른 시장 환경에서 포지션을 동적으로 조정하는 것을 고려할 수 있습니다.
- 손해 방지 제도를 개선한다 - 수익을 더 잘 보호하기 위해 손해 방지 추적 기능을 추가하는 것이 좋습니다.
- 시장 환경 필터 - 시장 환경 판단 지표를 추가하여 불안정한 시장에서 거래 빈도를 줄이거나 거래를 중지 할 수 있습니다.
- 최적화 매개 변수 선택 - 다른 시장과 품종에 대해 평균선 주기 및 OBV 매개 변수를 최적화하십시오.
요약하다
이 전략은 다중 주기적 트렌드 분석과 거래량 확인을 결합하여 비교적 완전한 트렌드 추적 시스템을 구축한다. 전략의 논리는 명확하고, 위험 통제는 합리적이지만 여전히 최적화 할 여지가 있다. 거래자는 실제에서 신중하게 테스트하고, 특정 시장 특성에 따라 파라미터를 조정하는 것이 좋습니다.
Source
Pine
/*backtest
start: 2024-09-01 00:00:00
end: 2025-02-18 08:00:00
period: 5d
basePeriod: 5d
exchanges: [{"eid":"Binance","currency":"BTC_USDT"}]
*/

//@version=6
strategy("Strategy: Daily MAs + OBV", overlay=true, initial_capital=10000, default_qty_type=strategy.percent_of_equity, default_qty_value=10, commission_type=strategy.commission.percent, commission_value=0.1)

//=== Daily Moving Averages Calculation =========================Related strategies
Comment
All comments (0)
No data
- 1