SRSI 및 MACD 지능형 위험 관리 시스템과 결합된 동적 적응형 다중 지표 교차 전략

2
Follow
478
Followers
개요
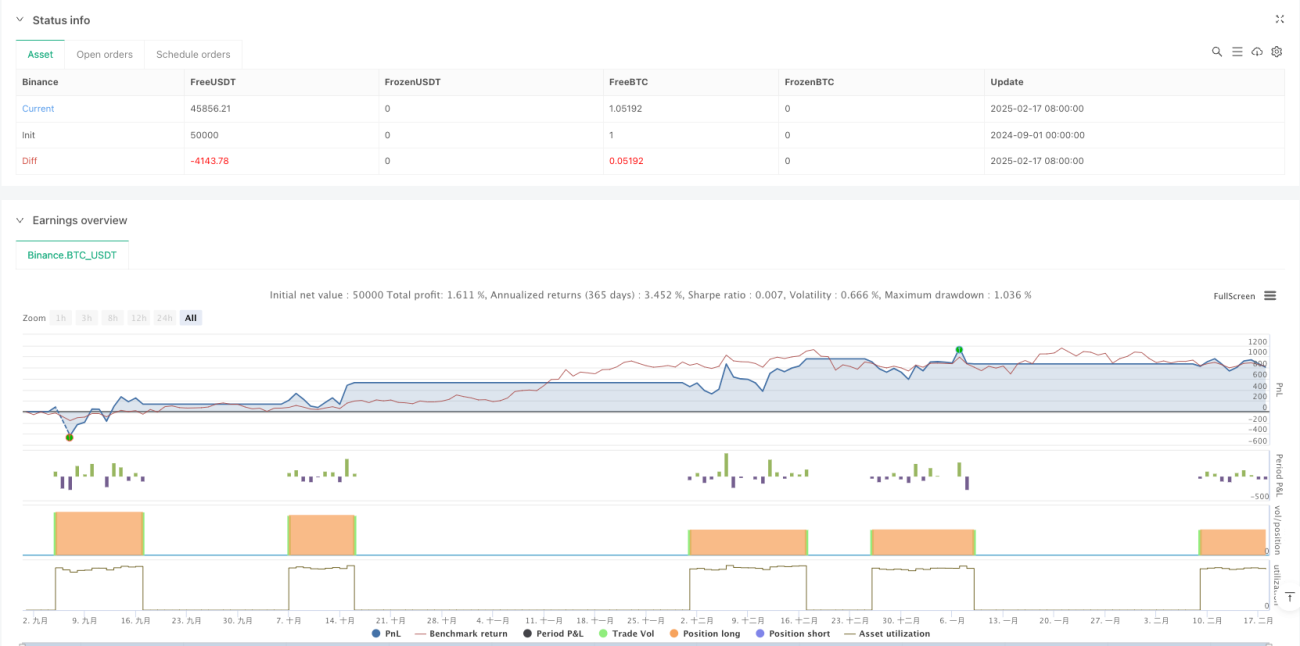
이 전략은 무작위적으로 상대적으로 약한 지표 ((SRSI) 와 이동 평균 동향/분산 지표 ((MACD) 를 결합한 동적 거래 시스템이다. ATR 지표를 통해 스톱로스와 스톱포트를 동적으로 조정하여 위험에 대한 지능적인 관리를 구현한다. 이 전략의 핵심은 다중 기술 지표의 교차 확인을 통해 거래 신호를 생성하는 것과 동시에 시장의 변동성을 결합하여 포지션 관리를 수행하는 것이다.
전략 원칙
이 전략은 다음과 같은 핵심 메커니즘을 기반으로 작동합니다.
- SRSI 지표의 K선과 D선, 그리고 K선과 통합 MACD의 차이를 계산하여 시장 흐름을 판단합니다.
- 구매 조건이 동시에 충족되어야 합니다: K-D 차이는 긍정적이고, K-MACD 차이는 긍정적이며, MACD는 하락 추세에 있지 않습니다.
- 판매 조건이 동시에 충족되어야 합니다: K-D 차이는 마이너스, K-MACD 차이는 마이너스, 그리고 MACD는 상승 추세에 있지 않습니다
- ATR을 사용하여 위험 계수를 동적으로 사용하여 시장의 변동성에 따라 조정되는 스톱로즈 및 스톱 거리 계산
전략적 이점
- 다중 신호 확인 메커니즘은 거래의 신뢰성을 크게 향상시키고 단일 지표로 인해 발생할 수있는 잘못된 신호를 방지합니다.
- 동적 스톱 스톱 설정은 시장의 변동에 따라 자동으로 조정할 수 있으며, 더 나은 위험-수익 비율을 제공합니다.
- 전략은 다양한 시장 환경에서 안정적인 성능을 유지할 수 있는 잘 적응
- 변수는 조정 가능하며 개인 위험 선호도에 따라 최적화 할 수 있습니다.
전략적 위험
- 불안한 시장에서 과도한 거래 신호가 발생할 수 있으며, 이는 시장의 출입을 유도합니다.
- 다중 지표의 사용은 신호를 지연시킬 수 있으며, 빠르게 변화하는 시장에서 최적의 진입 시기를 놓칠 수 있습니다.
- ATR은 역사적인 변동성을 기반으로 하고 시장 변동성에 따라 적절하게 대응할 수 없습니다.
- 너무 크거나 너무 작거나 전략의 효과에 영향을 미칠 수 있는 합리적인 위험 인자를 설정해야 합니다.
전략 최적화 방향
- 트렌드 필터를 추가하고, 흔들림 시장과 트렌드 시장에서 다른 신호 확인 기준을 사용합니다.
- 신호의 신뢰성을 높이기 위해 보조 확인으로 통행량 지표를 도입
- 스탠드 손실 스톱을 최적화 하는 계산 방법, 지원 저항 지점과 함께 고려할 수 있다
- 시장 변동률 예측 모형에 참여하여 위험 요소를 미리 조정합니다.
- 다양한 시간대에서 신호를 확인하는 것을 고려하여 전략의 안정성을 높여라
요약하다
이 전략은 SRSI와 MACD의 장점을 결합하여 안정적인 거래 시스템을 구축한다. 동적 위험 관리 메커니즘은 이를 잘 적응하게 하지만 여전히 거래자가 실제 시장 상황에 따라 매개 변수를 최적화해야 한다. 전략의 성공적인 운영은 시장에 대한 깊은 이해가 필요하며, 개인의 위험 감수 능력과 함께 합리적인 위치 관리를 수행한다.
Source
Pine
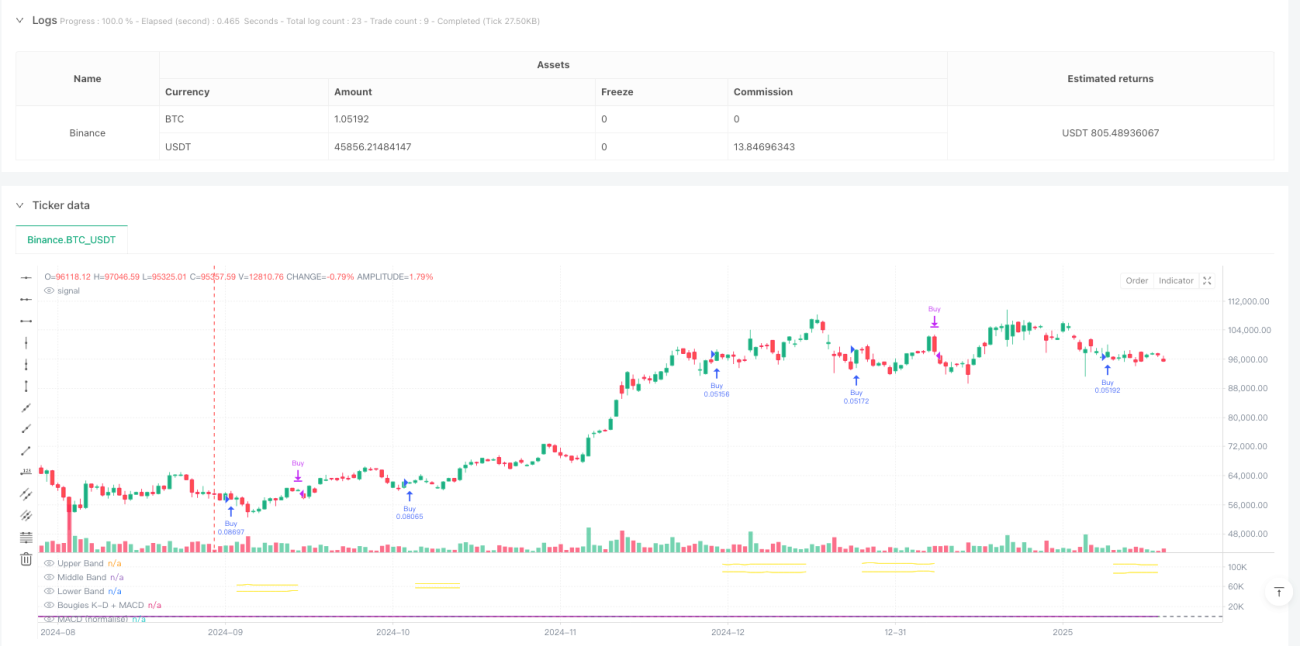
/*backtest
start: 2024-09-01 00:00:00
end: 2025-02-18 08:00:00
period: 1d
basePeriod: 1d
exchanges: [{"eid":"Binance","currency":"BTC_USDT"}]
*/

//@version=6
strategy(title="SRSI + MACD Strategy with Dynamic Stop-Loss and Take-Profit", shorttitle="SRSI + MACD Strategy", overlay=false, default_qty_type=strategy.percent_of_equity, default_qty_value=10)

// User InputsStrategy parameters
Related strategies
Comment
All comments (0)
No data
- 1