RSI 과매수 및 과매도 거래 전략과 결합된 고급 모멘텀 EMA 추세 추종

EMA RSI ATR SMA TP SL
생성 날짜: 2025-02-20 13:20:15 마지막으로 수정됨: 2025-02-20 13:20:15
복사: 1 클릭수: 366
avatar of ianzeng123 ianzeng123
2
집중하다
319
수행원

RSI 과매수 및 과매도 거래 전략과 결합된 고급 모멘텀 EMA 추세 추종 RSI 과매수 및 과매도 거래 전략과 결합된 고급 모멘텀 EMA 추세 추종

개요

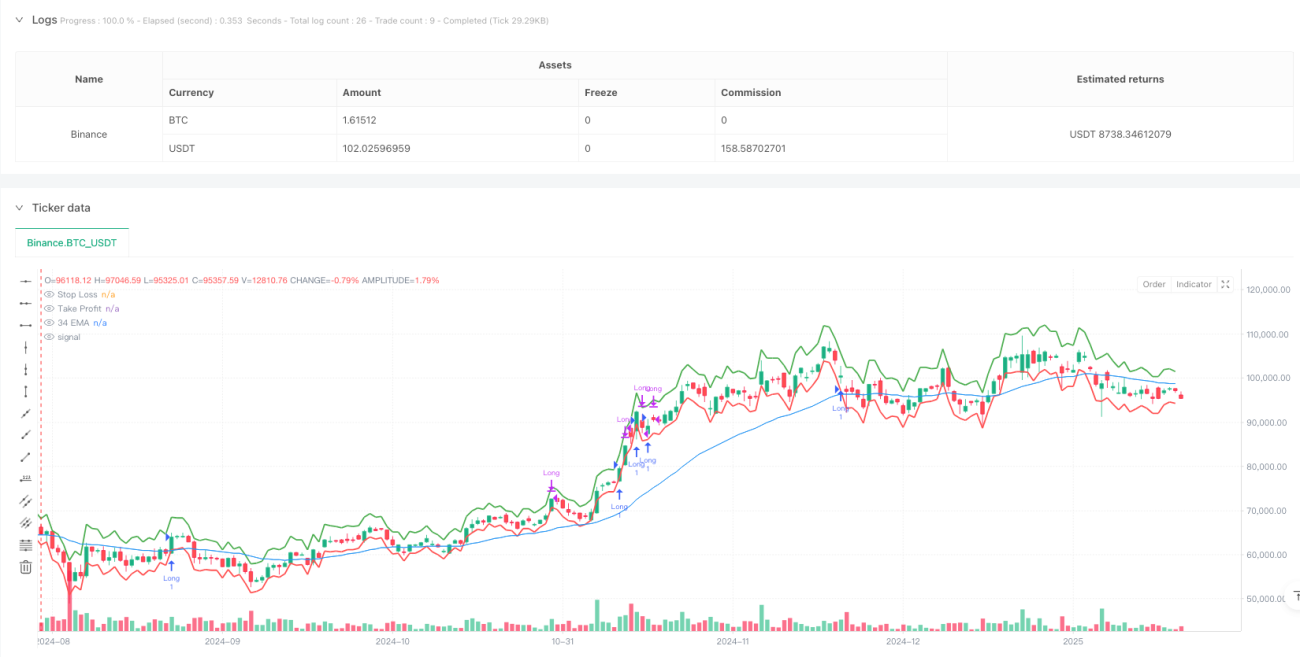
이 전략은 트렌드 추적과 역동성을 결합한 거래 시스템이다. 그것은 주로 34주기 EMA 평균을 기반으로 전체적인 트렌드를 판단하고, RSI 지표를 통해 과매매 지역을 식별하며, K선 형태와 거래량 확인 거래 신호를 결합한다. 전략은 ATR 기반의 동적 중지 손실 및 수익 방식을 채택하고, 시장의 변동성에 따라 거래 파라미터를 조정할 수 있다.

전략 원칙

전략의 핵심 논리에는 다음과 같은 핵심 요소가 포함됩니다.

  1. 트렌드 판단: 34주기 EMA를 주요 트렌드 지표로 사용하여 가격이 EMA 위에 있을 때만 더 많은 기회를 찾습니다.
  2. 입시 조건: 연속적으로 나타나는 “陰-陽-陽” K선 조합 형태를 요구한다. 즉, 한 개의陰線에 두 개의陽線이 이어진다.
  3. 동력 확인: RSI 지표를 사용하여 동력 확인, RSI 값이 50보다 크면 상승 동력을 나타냅니다.
  4. 거래량 필터: 충분한 시장 참여를 보장하기 위해 현재 거래량이 20주기 평균 거래량보다 크기를 요구합니다.
  5. 위험 관리: ATR의 1.5배를 수익 목표로, ATR의 1배를 중지 위치로 사용

전략적 이점

  1. 다중 신호 확인: 트렌드, 형태, 운동 및 거래량과 결합하여 거래 확인을 수행하여 가짜 신호를 효과적으로 감소시킵니다.
  2. 다이내믹 리스크 관리: ATR 기반의 중지 및 수익 설정, 시장의 변동성에 따라 자동으로 조정할 수 있습니다.
  3. 트렌드 추적 기능: EMA를 통해 주요 트렌드 방향으로 거래하는 것을 보장하여 승률을 높여줍니다.
  4. 유연한 변수 설정: EMA 주기와 RSI 하위값, ATR 배수 등과 같은 핵심 변수들은 다양한 시장 환경에 맞게 조정할 수 있습니다.

전략적 위험

  1. 트렌드 리버스 위험: 트렌드 전환점에서 연쇄 손실이 발생할 수 있습니다.
  2. 가짜 돌파 위험: K선 형태는 가짜 돌파가 발생하여 잘못된 신호를 유발할 수 있다.
  3. 시장의 변동 위험: ATR 값이 급격한 변동이 있을 때 비정상적으로 커져서 HST 설정에 영향을 미칠 수 있습니다.
  4. 매개 변수 민감성: 다른 시장 환경에서 최적 매개 변수가 크게 다를 수 있다.

전략 최적화 방향

  1. 트렌드 강도 필터를 추가: 트렌드 강도를 측정하는 ADX 지표가 도입되어 강세를 통해서만 거래할 수 있습니다.
  2. 출전 메커니즘을 개선: 이동식 손해제도 추가, 이윤도 보호
  3. 거래량 지표를 최적화: 상대적인 거래량 또는 거래량 돌파구 지표를 사용하는 것을 고려하십시오.
  4. 시간 필터 추가: 거래 시간 창을 추가하여 변동성이 높은 시기를 피할 수 있습니다.
  5. 시장 환경 분류를 도입합니다: 다양한 시장 환경 동력에 따라 전략 매개 변수를 조정합니다.

요약하다

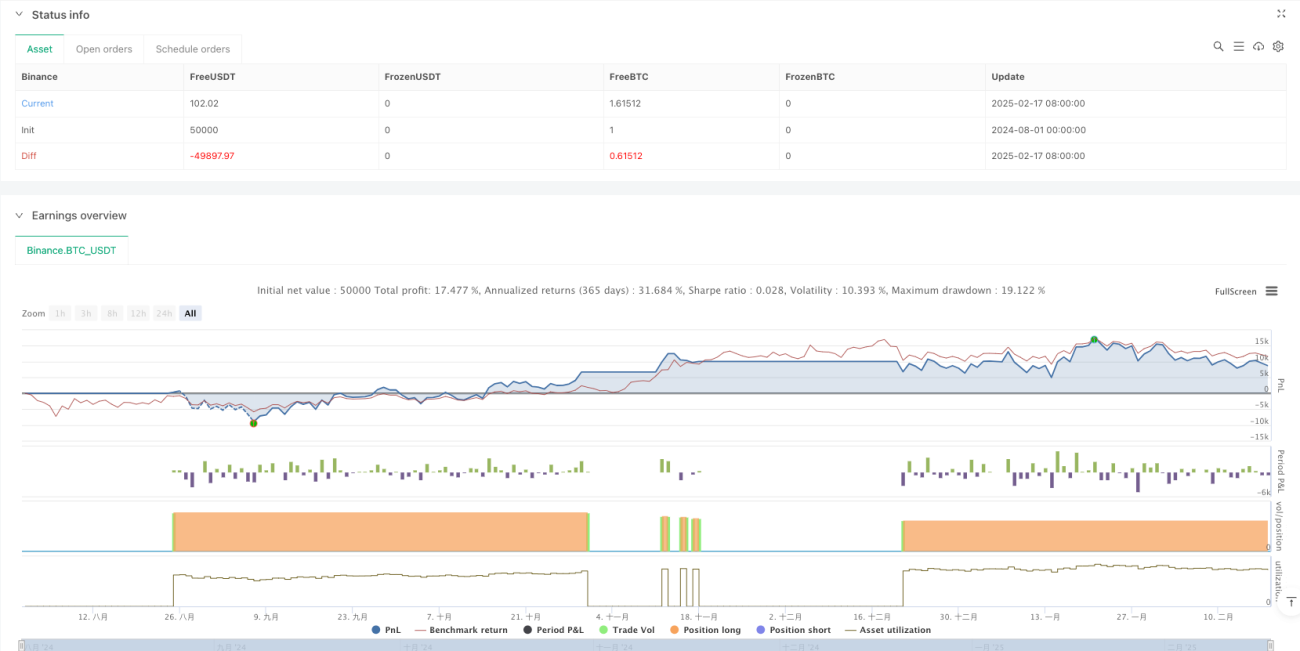
이 전략은 여러 기술 지표를 결합하여 전체적인 거래 시스템을 구축하여 잘 적응하고 확장할 수 있습니다. 전략의 핵심 장점은 다차원 신호 확인과 동적 위험 관리에 있습니다. 그러나 또한 매개 변수 최적화 및 시장 환경에 대한 적응성에 주의를 기울여야합니다. 지속적인 최적화 및 개선으로 이 전략은 다양한 시장 환경에서 안정적인 성능을 유지할 수 있습니다.

전략 소스 코드
/*backtest
start: 2024-08-01 00:00:00
end: 2025-02-18 08:00:00
period: 1d
basePeriod: 1d
exchanges: [{"eid":"Binance","currency":"BTC_USDT"}]
*/

// This Pine Script™ code is subject to the terms of the Mozilla Public License 2.0 at https://mozilla.org/MPL/2.0/
// © bommytarton

//@version=6
strategy("Improved Momentum and Pivot Reversal Strategy", overlay=true)

// Define user inputs
lengthEMA = input.int(34, title="EMA Length", minval=1)
lengthRSI = input.int(14, title="RSI Length", minval=1)
rsiOverbought = input.int(70, title="RSI Overbought Level", minval=50, maxval=100)
rsiOversold = input.int(30, title="RSI Oversold Level", minval=0, maxval=50)
lengthATR = input.int(14, title="ATR Length", minval=1)
multATR = input.float(1.5, title="ATR Multiplier for Take-Profit", minval=1.0)
stopLossMultiplier = input.float(1.0, title="Stop Loss Multiplier for ATR", minval=0.5, maxval=3.0) // Adjust the stop-loss to be tighter or wider

// Calculate the indicators
ema34 = ta.ema(close, lengthEMA)
rsiValue = ta.rsi(close, lengthRSI)
atrValue = ta.atr(lengthATR)

// Define entry conditions
longCondition = close > ema34 and close[1] < open[1] and close > open and close[2] > open[2] and close[1] < open[1] and rsiValue > 50

// Define stop-loss and take-profit based on ATR
stopLoss = close - (atrValue * stopLossMultiplier) // Tighter stop-loss using the ATR multiplier
takeProfit = close + (atrValue * multATR) // Take profit with adjustable multiplier

// Volume condition filter (make sure that the volume is higher than average over the past 20 bars)
avgVolume = ta.sma(volume, 20)
volumeCondition = volume > avgVolume

// Only trigger long if all conditions are met (trend above 34 EMA, red-green-green candle pattern, volume confirmation)
if (longCondition and volumeCondition)
    strategy.entry("Long", strategy.long, stop=stopLoss, limit=takeProfit)

// Exit conditions based on RSI overbought/oversold and trailing stop
exitCondition = rsiValue > rsiOverbought or close < stopLoss

// Execute the exit strategy when RSI is overbought or price hits the stop-loss level
if (exitCondition)
    strategy.close("Long")  // Close the position when exit condition is met

// Plotting for visualization
plot(ema34, title="34 EMA", color=color.blue)
plot(stopLoss, title="Stop Loss", color=color.red, linewidth=2)
plot(takeProfit, title="Take Profit", color=color.green, linewidth=2)