
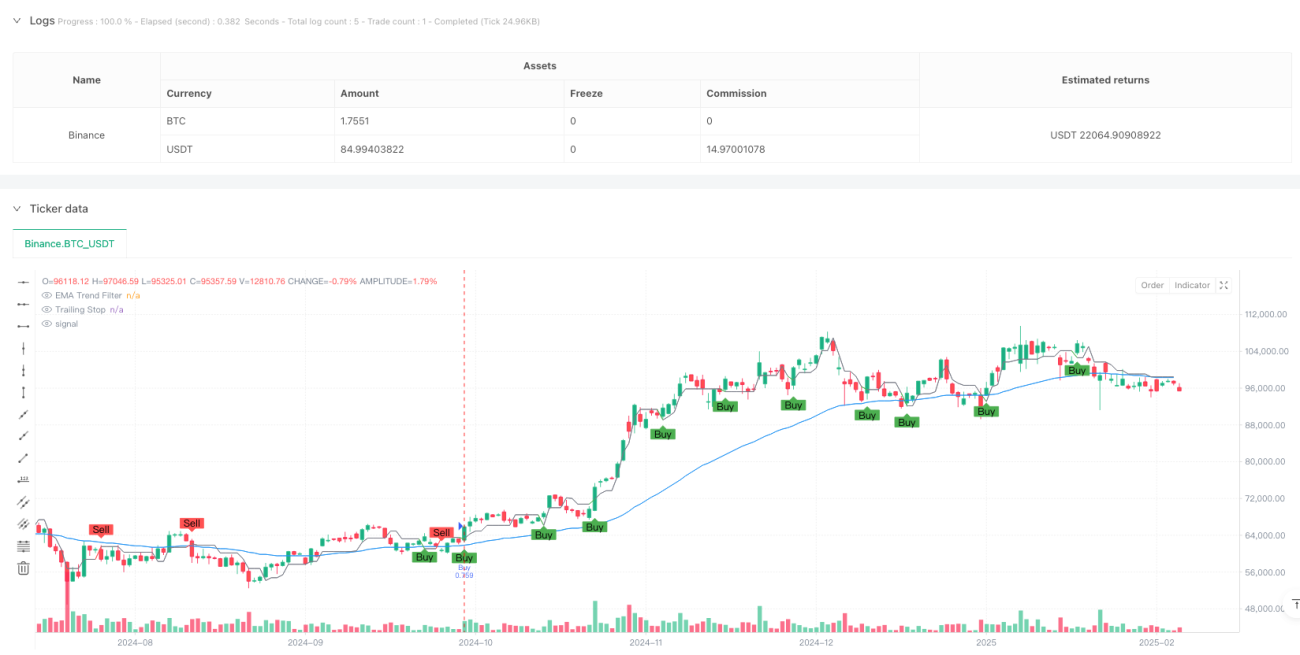
이 전략은 ATR (평균 실제 파장) 에 기반한 동적으로 손실을 추적하는 트렌드 추적 시스템이다. 그것은 EMA 평선을 트렌드 필터로 결합하고, 민감도 파라미터와 ATR 주기를 조정하여 신호의 생성을 제어한다. 시스템은 더 많은 것을 지원할 뿐만 아니라 적자를 지원하며, 완벽한 수익 관리 메커니즘을 가지고 있다.
이것은 구조적으로 완전하고 논리적으로 명확한 트렌드 추적 시스템이다. ATR 동적 추적과 EMA 트렌드 필터를 결합하여 트렌드를 파악하면서 위험을 더 잘 통제한다. 분기 수익 메커니즘의 설계도 성숙한 거래 사고를 나타냅니다. 전략은 강력한 실용성과 확장성을 가지고 있으며, 지속적인 최적화와 개선으로 더 나은 거래 효과를 얻을 수 있습니다.
/*backtest
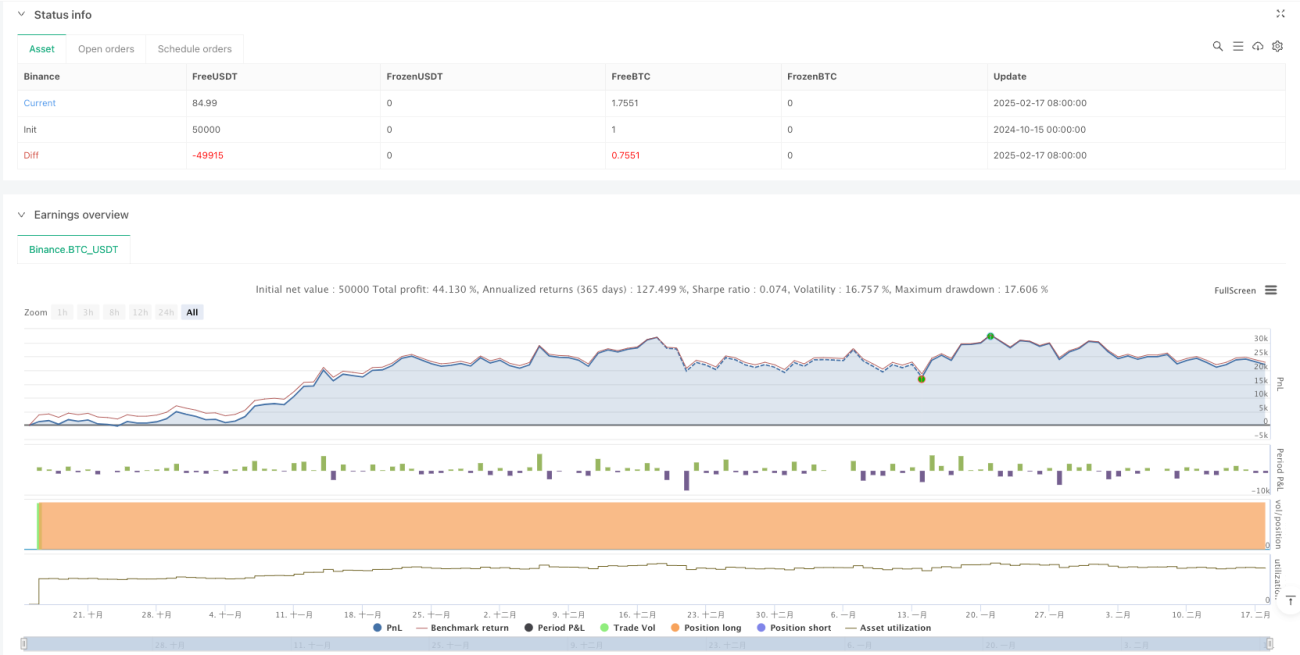
start: 2024-10-15 00:00:00
end: 2025-02-18 08:00:00
period: 1d
basePeriod: 1d
exchanges: [{"eid":"Binance","currency":"BTC_USDT"}]
*/
//@version=5
strategy("Enhanced UT Bot with Long & Short Trades", overlay=true, default_qty_type=strategy.percent_of_equity, default_qty_value=100)
// Input Parameters
keyvalue = input.float(1.1, title="Key Value (Sensitivity)", step=0.1)
atrperiod = input.int(200, title="ATR Period")
emaPeriod = input.int(50, title="EMA Period")
roi_close = input.float(100, title="Close Trade at ROI (%)", step=1)
// ATR Calculation
src = close
xATR = ta.atr(atrperiod)
nLoss = keyvalue * xATR
// EMA for Trend Filtering
ema = ta.ema(src, emaPeriod)
// Trailing Stop Logic
var float xATRTrailingStop = na
if na(xATRTrailingStop)
xATRTrailingStop := src - nLoss
if src > nz(xATRTrailingStop[1]) and src[1] > nz(xATRTrailingStop[1])
xATRTrailingStop := math.max(nz(xATRTrailingStop[1]), src - nLoss)
else if src < nz(xATRTrailingStop[1]) and src[1] < nz(xATRTrailingStop[1])
xATRTrailingStop := math.min(nz(xATRTrailingStop[1]), src + nLoss)
else
xATRTrailingStop := src > nz(xATRTrailingStop[1]) ? src - nLoss : src + nLoss
// Buy/Sell Signal with Trend Filter
buySignal = ta.crossover(src, xATRTrailingStop) and src > ema
sellSignal = ta.crossunder(src, xATRTrailingStop) and src < ema
// Strategy Logic: Long Trades
if buySignal and strategy.position_size <= 0
strategy.entry("Buy", strategy.long)
if sellSignal and strategy.position_size > 0
strategy.close("Buy")
// Strategy Logic: Short Trades
if sellSignal and strategy.position_size >= 0
strategy.entry("Sell", strategy.short)
if buySignal and strategy.position_size < 0
strategy.close("Sell")
// ROI Calculation for Both Long and Short Trades
var float entryPrice = na
var bool isLong = na
if strategy.position_size > 0
entryPrice := strategy.opentrades.entry_price(0)
isLong := true
if strategy.position_size < 0
entryPrice := strategy.opentrades.entry_price(0)
isLong := false
// Calculate current profit
currentProfit = isLong ? (close - entryPrice) / entryPrice * 100 : (entryPrice - close) / entryPrice * 100
// Enhanced ROI Management
if strategy.position_size > 0 // Long Position
if currentProfit >= 20 and currentProfit < 50
stopLevel = entryPrice // Breakeven
strategy.exit("TSL Breakeven", from_entry="Buy", stop=stopLevel)
if currentProfit >= 50 and currentProfit < 80
stopLevel = entryPrice * 1.30 // 30% ROI
strategy.exit("TSL 30%", from_entry="Buy", stop=stopLevel)
strategy.close("Partial Profit", qty_percent=50) // Take 50% profit
if currentProfit >= 80 and currentProfit < roi_close
stopLevel = entryPrice * 1.60 // 60% ROI
strategy.exit("TSL 60%", from_entry="Buy", stop=stopLevel)
if currentProfit >= roi_close
strategy.close("Full Exit at 100% ROI")
if strategy.position_size < 0 // Short Position
if currentProfit >= 20 and currentProfit < 50
stopLevel = entryPrice // Breakeven
strategy.exit("TSL Breakeven", from_entry="Sell", stop=stopLevel)
if currentProfit >= 50 and currentProfit < 80
stopLevel = entryPrice * 0.70 // 30% ROI (Short stop)
strategy.exit("TSL 30%", from_entry="Sell", stop=stopLevel)
strategy.close("Partial Profit", qty_percent=50) // Take 50% profit
if currentProfit >= 80 and currentProfit < roi_close
stopLevel = entryPrice * 0.40 // 60% ROI (Short stop)
strategy.exit("TSL 60%", from_entry="Sell", stop=stopLevel)
if currentProfit >= roi_close
strategy.close("Full Exit at 100% ROI")
// Plotting
plot(xATRTrailingStop, color=buySignal ? color.green : sellSignal ? color.red : color.gray, title="Trailing Stop")
plot(ema, color=color.blue, title="EMA Trend Filter")
plotshape(buySignal, title="Buy Signal", style=shape.labelup, location=location.belowbar, color=color.green, text="Buy")
plotshape(sellSignal, title="Sell Signal", style=shape.labeldown, location=location.abovebar, color=color.red, text="Sell")