RSI 강도 및 약점 필터링 거래 전략과 결합된 이중 이동 평균 교차

2
Follow
478
Followers
RSI 강도 필터링 트레이딩 전략과 함께 쌍방향 이동 평균 교차
개요
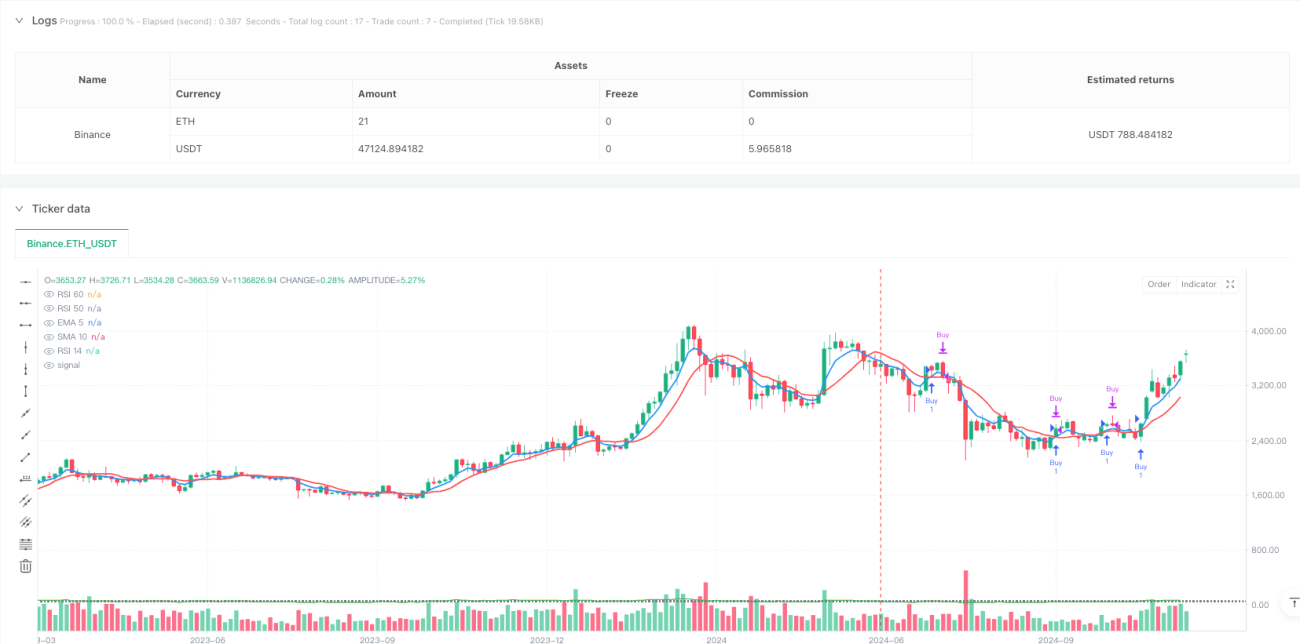
이 전략은 양평선 교차와 RSI 지표 필터링을 결합한 거래 시스템이다. 전략은 5주기 지수 이동 평균 ((EMA5)) 과 10주기 단순 이동 평균 ((SMA10) 을 주요 트렌드 판단 도구로 사용하며, 14주기 상대적으로 강한 지수 ((RSI14) 를 거래 신호 필터로 도입하여 엄격한 입출장 조건을 통해 거래의 정확성을 향상시킵니다.
전략 원칙
이 전략의 핵심 논리는 두 가지 핵심 기술 지표의 조합에 기반합니다.
- 쌍평선 시스템: EMA5와 SMA10의 교차로 트렌드 변화를 포착하기 위해 사용된다
- EMA5가 SMA10을 상향으로 통과하면 다중 신호가 생성됩니다.
- EMA5가 SMA10을 아래로 통과하면 공백 신호가 발생한다
- RSI 필터링 시스템:
- 다중 조건은 RSI14 값이 60보다 크기를 요구합니다.
- 공백 조건은 RSI14 값이 50보다 작아야 합니다.
- 거래 신호를 확인하기 위해 가격이 RSI를 넘어야 합니다.
전략적 이점
-
신호 확인 메커니즘
- 쌍평선 교차를 통해 초기 신호를 제공
- RSI 필터를 사용하여 2차 확인
- 최종 확정으로 RSI 핵심 수준을 넘어서야 합니다.
-
리스크 관리가 효과적입니다.
- 명확한 입출소 조건이 설정되어 있습니다.
- 역신호를 이용한 자동 평점 메커니즘
- RSI 지표는 잠재적인 가짜 신호를 필터링합니다.
-
전략 논리가 명확합니다.
- 지표 포지션은 간단하고 이해하기 쉽습니다.
- 거래 규칙은 명확하고 구체적입니다.
- 조정 및 최적화
전략적 위험
-
변동성 있는 시장의 위험
- 빈번한 평행선 교차로 인해 과도한 거래가 발생할 수 있습니다.
- 수평 시장에서 잘못된 신호가 발생할 수 있습니다.
- 명확한 추세에서 사용하는 것이 좋습니다.
-
지연 위험
- 이동 평균은 그 자체로 지연적입니다.
- RSI 확인이 일부 미처 확인되지 않은 사건으로 이어질 수 있습니다.
- 시간적성과 정확성의 균형을 잡아야 합니다.
-
매개변수 민감도
- 평균선 주기 설정은 신호 주파수에 영향을 미칩니다.
- RSI 미지값 설정이 필터링 효과를 영향을 미칩니다.
- 다른 시장 환경은 다른 매개 변수를 요구할 수 있습니다.
전략 최적화 방향
-
트렌드 강도 필터를 도입합니다.
- ADX 지표의 트렌드 판단 강도를 높여
- 강세를 보면 더 느슨한 RSI 필터링 조건을 사용합니다.
- 약한 추세에서 필터링 조건의 강화
-
최적화 매개 변수가 적응
- 시장의 변동에 따라 수평선 주기 조정
- 시장 상황에 따라 RSI 하락값을 자동으로 조정합니다.
- 적응 알고리즘 최적화 파라미터 선택
-
위험 관리 개선
- 더 많은 손해 방지 장치
- 포지션 관리 기능을 구현
- 추가 거래 비용 고려
요약하다
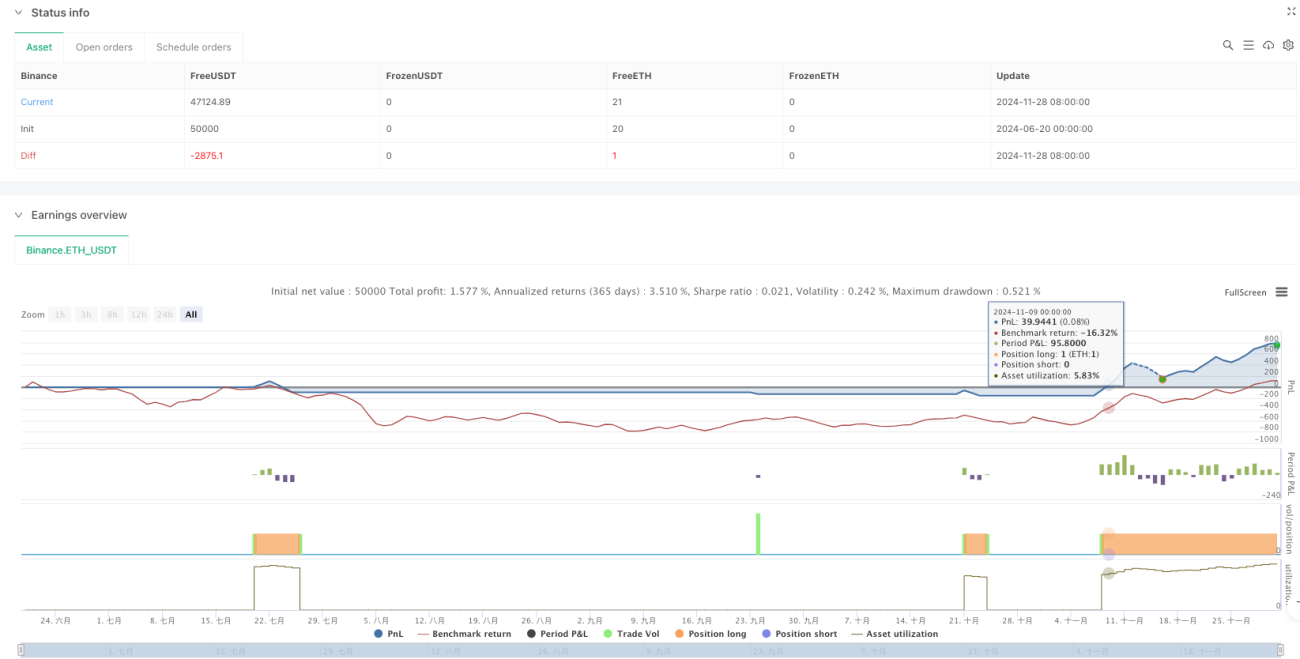
이 전략은 쌍평선 크로스와 RSI 필터를 결합하여 비교적 완벽한 거래 시스템을 구축한다. 전략의 주요 장점은 신호 확인 메커니즘과 위험 제어 조치이지만, 일부 고유한 한계도 있다. 제안된 최적화 방향을 통해 전략은 실제 거래에서 더 나은 성과를 낼 것으로 예상된다. 특히 추세가 명확한 시장 환경에서 전략의 성과는 더 안정적일 수 있다.
Source
Pine
Related strategies
Comment
All comments (0)
No data
- 1