
2
Follow
478
Followers
개요
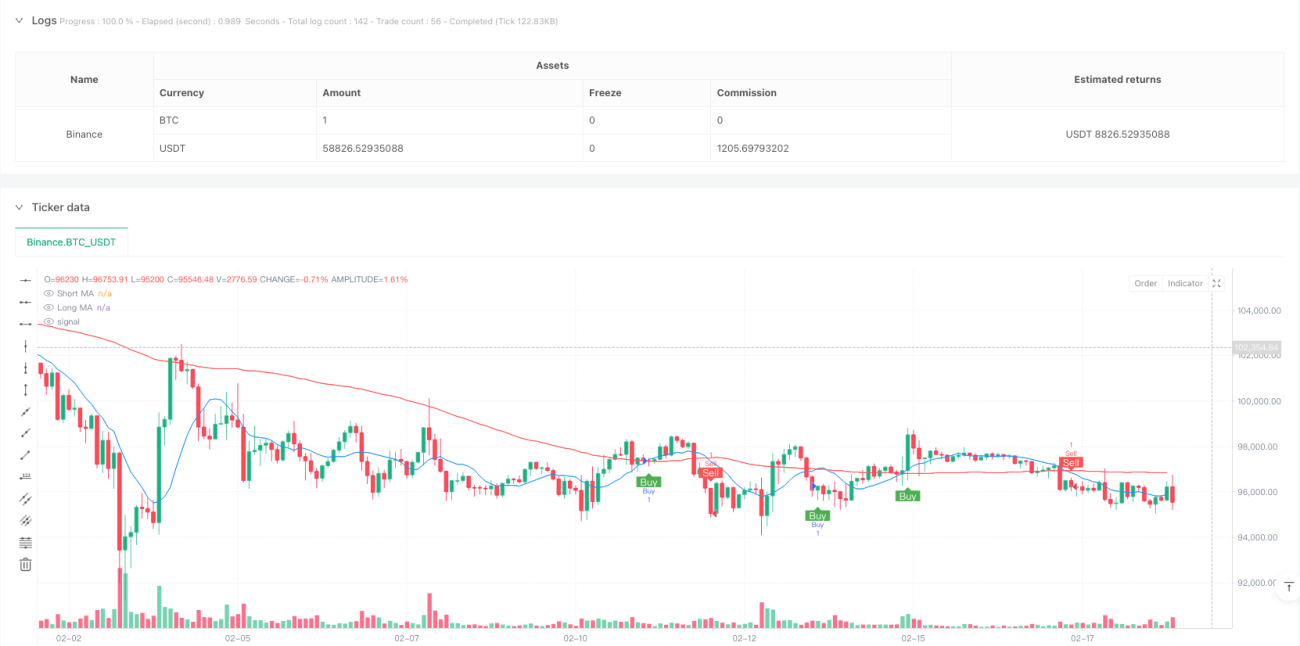
이 전략은 쌍평선 교차 신호와 동적 위험 관리를 결합한 거래 시스템이다. 단기 및 장기 이동 평균의 교차를 통해 거래 신호를 생성하고, ATR 지표를 사용하여 동적으로 중지 손실 및 이득 위치를 조정하며, 거래 품질을 최적화하기 위해 시간 필터링 및 냉각 기간을 도입한다. 이 전략에는 위험 수익률 및 거래 당 위험 비율의 관리 장치도 포함되어 있다.
전략 원칙
이 전략은 다음과 같은 핵심 구성 요소를 기반으로 합니다.
- 신호 생성 시스템은 단기 ((10주기) 와 장기 ((100주기) 의 간단한 이동 평균의 교차를 사용하여 거래를 촉발한다. 단기 평균선이 장기 평균선을 상향으로 통과하면 다중 신호가 발생하고, 반대로 하위 신호가 발생한다.
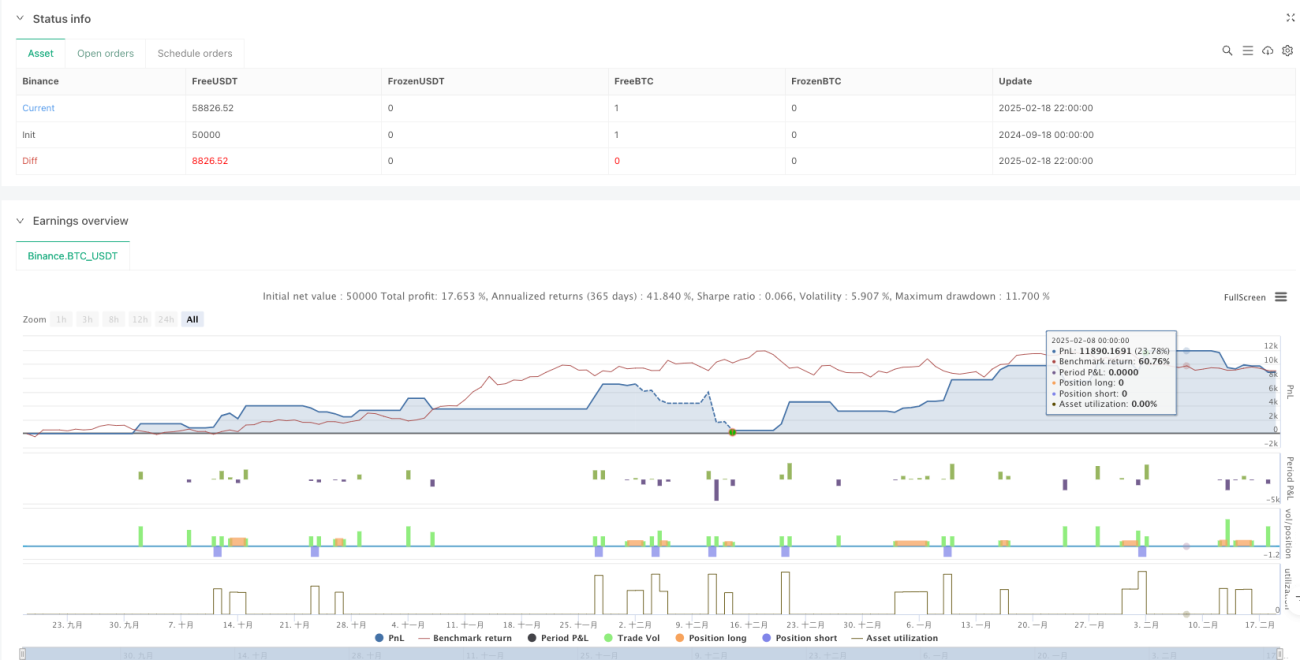
- 리스크 관리 시스템은 14주기 ATR을 1.5배의 계수로 동적 스톱 로드 거리를 설정하고, 수익 목표를 스톱 로드 거리의 2배로 설정한다.
- 시간 필터는 사용자가 거래의 특정 기간을 설정하여 지정된 시간 범위 내에서만 거래를 수행 할 수 있도록합니다.
- 거래 냉각기 메커니즘은 과도한 거래를 방지하기 위해 10 회의 대기 시간을 설정합니다.
- 각 거래의 위험은 계좌의 1%에 통제됩니다.
전략적 이점
- 동적 위험 관리: ATR 지표를 사용하여 시장의 변동성에 적응하여 다른 시장 환경에서 자동으로 중지 손실과 수익 거리를 조정합니다.
- 전체적인 위험 제어: 위험과 수익의 비율과 거래당 위험 비율을 설정하여 체계적인 자금 관리를 구현한다.
- 유연한 시간관리: 거래시간을 다른 시장의 거래시간 특성에 따라 조정할 수 있다.
- 과도한 거래 방지: 냉각 기간 메커니즘은 급격한 변동 기간에 과도한 거래 신호를 방지하는 데 효과적입니다.
- 시각화 효과: 거래 신호와 이동 평균을 그래프에 명확하게 표시하여 분석 및 최적화를 용이하게 합니다.
전략적 위험
- 트렌드 반전의 위험: 불안한 시장에서 가짜 브레이크 신호가 발생하여 연속적인 손실이 발생할 수 있습니다.
- 변수 감수성: 이동 평균 주기, ATR 배수 등의 변수의 선택은 전략의 성과에 현저하게 영향을 미칩니다.
- 시간 필터를 잘못 설정하면 중요한 거래 기회를 놓칠 수 있습니다.
- 고정된 리스크/이익 비율은 다른 시장 환경에서 충분히 유연하지 않을 수 있습니다.
전략 최적화 방향
- 트렌드 강도 필터를 도입: 트렌드 강도를 판단하기 위해 ADX 또는 유사한 지표를 추가할 수 있으며, 강한 트렌드 동안만 거래한다.
- 동적으로 조정된 위험 수익률: 시장의 변동성이나 추세 강도에 따라 자동으로 조정되는 위험 수익률.
- 거래량 분석: 거래량을 신호 확인의 추가적인 지표로 사용한다.
- 냉각 기간을 최적화 하는 장치: 냉각 기간의 길이는 시장의 변동적 동력에 따라 조정된다.
- 시장 환경 분류에 추가: 다른 시장 환경에서 다른 파라미터 조합을 사용한다.
요약하다
이 전략은 고전적인 기술 분석 방법과 현대적 위험 관리 관념을 결합하여 완전한 거래 시스템을 구축한다. 그것의 핵심 장점은 역동적인 위험 관리와 다중 필터링 메커니즘에 있다. 그러나 실제 응용에서 특정 시장 특성에 따라 변수를 최적화해야 한다. 전략의 성공적인 운영은 거래자가 각 구성 요소의 역할을 깊이 이해하고 시장 변화에 따라 변수를 제때 조정해야 한다.
Source
Pine
/*backtest
start: 2024-09-18 00:00:00
end: 2025-02-19 00:00:00
period: 2h
basePeriod: 2h
exchanges: [{"eid":"Binance","currency":"BTC_USDT"}]
*/

//@version=5
strategy("Profitable Moving Average Crossover Strategy", shorttitle="Profitable MA Crossover", overlay=true)

// Input parameters for the moving averagesStrategy parameters
Related strategies
Comment
All comments (0)
No data
- 1