
2
Follow
478
Followers
개요
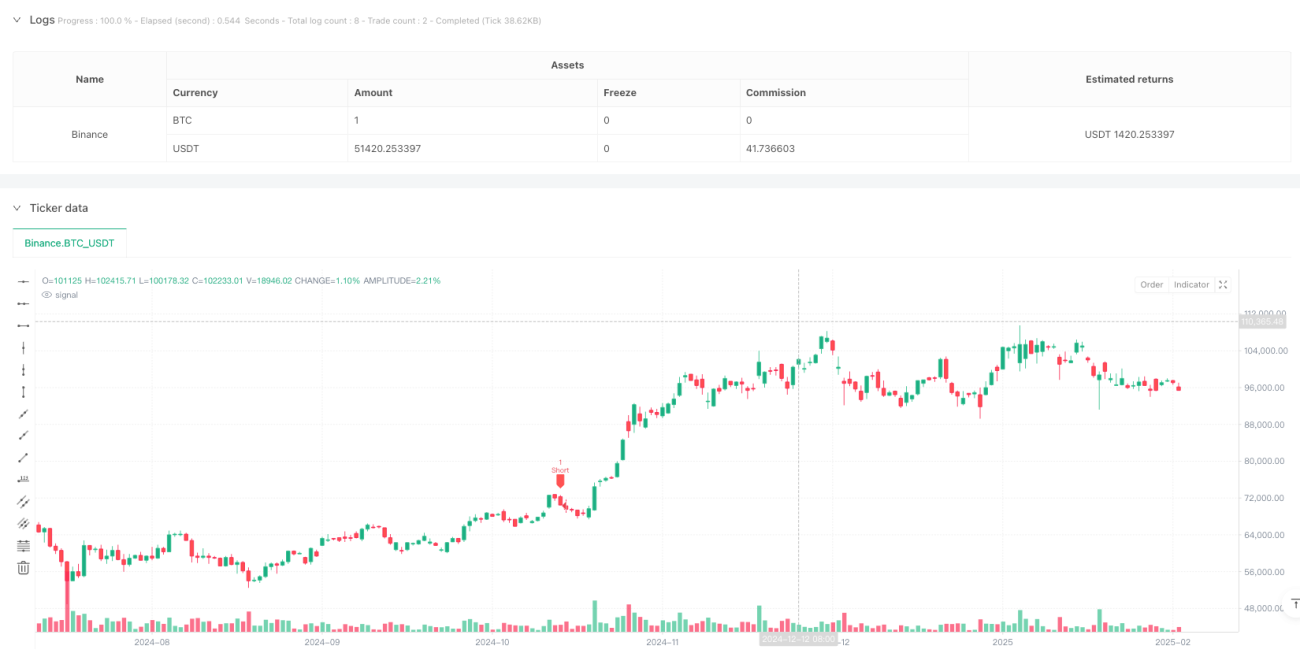
이 전략은 무작위 지표 (Stochastic Oscillator) 에 기반한 다시간 프레임波段 거래 시스템이다. 현재 시간 프레임과 더 높은 시간 프레임의 무작위 지표 신호를 결합하여 거래 기회를 결정하고, 동적 스톱 로즈를 사용하여 위험을 관리한다. 이 전략은 변동성이 높은 시장에 적용되며, 가격의 단기 변동을 포착하여 수익을 얻는다.
전략 원칙
전략의 핵심 논리는 다음과 같은 핵심 요소에 기초합니다.
- 임의 지표를 사용하여 두 시간 프레임 (현재 및 더 높은 수준) 에서 신호 확인
- 오버 바이 오버 세일 지역에서 교차 신호를 찾아보세요.
- 구매 조건: 현재 시간 프레임 K 라인에 D 라인을 통과하고 K 값이 <20; 더 높은 시간 프레임 K 값 <20 그리고 K> D
- 판매 조건: 현재 시간 프레임 K에서 D를 통과하고 K 값이> 80; 더 높은 시간 프레임 K 값> 80 및 K <D
- 입시 가격에 기반한 동적 스톱 스톱 손실 시스템을 적용하여 스톱 스톱 손실 배수를 조정할 수 있습니다.
전략적 이점
- 다중 시간 프레임 신호 확인은 거래의 신뢰성을 높이고, 가짜 신호를 효과적으로 감소시킵니다.
- 오버 바이 오버 셀 지역에서 거래하는 것은 트렌드 반전의 가능성을 높여줍니다.
- 다이내믹 스톱 스톱 손실 시스템은 시장의 변동에 따라 자동으로 조정할 수 있으며, 자금 관리의 유연성을 향상시킵니다.
- 그래픽 인터페이스는 거래 신호와 스톱 스로프 위치를 직관적으로 표시하여 거래자가 이해하기 쉽고 작동 할 수 있습니다.
- 다양한 시장 환경에 대응할 수 있는 전략 변수
전략적 위험
- 급격하게 변동하는 시장에서 빈번하게 손실이 발생할 수 있는 상황
- 이중 시간 프레임 확인으로 인해 거래 기회를 놓칠 수 있습니다.
- 고정 배수의 스톱 스톱 손실은 모든 시장 환경에 적합하지 않을 수 있습니다.
- 트렌드가 강할 때는 너무 일찍 멈출 수도 있습니다.
- 이익과 위험을 균형 잡기 위해 합리적인 매개 변수를 설정해야 합니다.
전략 최적화 방향
- 시장의 변동에 따라 동적으로 조정되는 적응형 스톱 손실 메커니즘을 도입합니다.
- 트렌드 필터를 추가하여 강력한 트렌드에서 거래 방향을 조정합니다.
- 거래량 지표가 보조 확인 신호로 추가되었습니다.
- 더 지능적인 포지션 관리 시스템을 개발
- 시장에 진입 시기를 최적화하기 위해 시장 감정 지표를 고려하십시오.
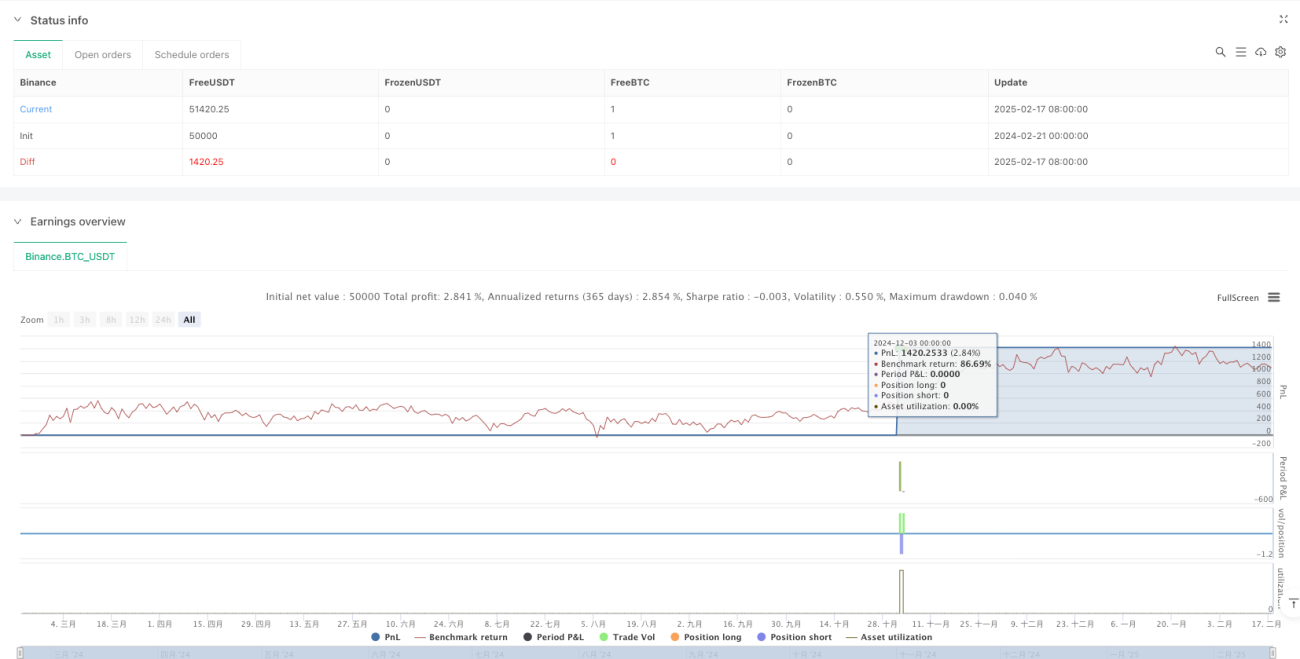
요약하다
이것은 기술 분석과 위험 관리를 결합한 완전한 거래 시스템이다. 다중 시간 프레임의 신호 확인과 동적 중지 중지으로, 전략은 안정성을 보장하면서도 좋은 수익 잠재력을 가지고 있다. 그러나 사용자는 자신의 거래 스타일과 시장 환경에 따라 파라미터를 최적화하고 항상 엄격한 위험 통제를 유지해야합니다.
Source
Pine
Strategy parameters
Comment
All comments (0)
No data
- 1