변동성 모멘텀 돌파 거래 전략 트렌드 및 모멘텀 필터 결합

ATR EMA RSI HH LL RR
생성 날짜: 2025-02-20 15:13:31 마지막으로 수정됨: 2025-02-20 15:13:31
복사: 1 클릭수: 401
avatar of ianzeng123 ianzeng123
2
집중하다
319
수행원

변동성 모멘텀 돌파 거래 전략 트렌드 및 모멘텀 필터 결합 변동성 모멘텀 돌파 거래 전략 트렌드 및 모멘텀 필터 결합

개요

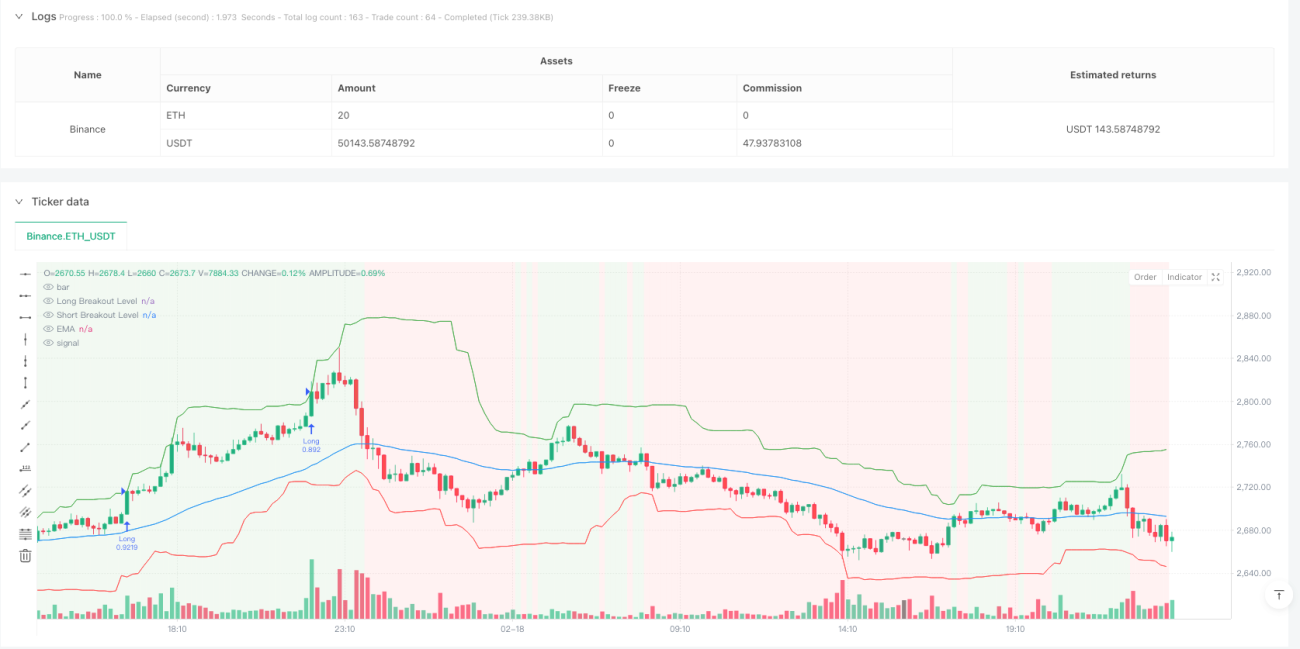
이 전략은 변동률 돌파구, 트렌드 추적 및 동력 확인을 결합한 정량화 거래 시스템이다. ATR 기반의 동적 돌파구 수준을 계산하여 EMA 트렌드 필터링 및 RSI 동력 지표와 결합하여 거래 기회를 식별한다. 전략은 고정된 비율 위험 관리 및 동적 스톱 스텝 설정을 포함한 엄격한 위험 제어 조치를 취한다.

전략 원칙

이 전략은 세 가지 핵심 요소로 구성되어 있습니다.

  1. 변동률 돌파구 계산: 회귀 기간 내의 최고 가격과 최저 가격을 사용하여, ATR 배수 계산과 결합하여 동적 돌파구 절벽을 계산하여, 포커스 편차를 피한다.
  2. 트렌드 필터: 단기 EMA를 사용하여 현재 트렌드 방향을 판단하고, EMA 위에 있는 가격에서만 더 많은 주문을 열고, EMA 아래에 있는 빈 주문을 열기.
  3. 동력 확인: RSI 지표를 사용하여 시장 동력을 확인, 다중 입장은 RSI가 50보다 크며, 공허 입장은 RSI가 50보다 작습니다.

전략적 이점

  1. 동적 적응성: 시장의 변동에 따라 돌파구 수준이 자동으로 조정되어 전략이 다른 시장 환경에 적응할 수 있습니다.
  2. 복수 필터링: 트렌드와 동력 지표의 결합으로 가짜 신호를 줄인다.
  3. 엄격한 위험 제어: 고정된 위험 비율을 사용하여 포지션을 관리하고, 동적 중지 손실 보호를 사용합니다.
  4. 커스터마이징성 강: ATR 주기, 돌파배수, EMA 주기 등과 같은 핵심 매개 변수는 특정 요구에 따라 조정할 수 있다.

전략적 위험

  1. 지연 위험: 이동 평균과 같은 지표의 사용은 입점 지연으로 이어질 수 있다.
  2. 흔들림 시장 위험: 가로판 흔들림 시장에서 빈번한 가짜 브레이크 신호가 발생할 수 있다.
  3. 매개 변수 감수성: 전략의 성능은 매개 변수 설정에 민감하며, 충분한 테스트가 필요하다. 해결책:
  • 다양한 시장 환경에서의 재검토 및 최적화를 제안합니다.
  • 시장 환경 인식 모듈을 추가할 수 있습니다.
  • 좀 더 보수적인 재무 관리 방안을 제안합니다.

전략 최적화 방향

  1. 시장 환경 적응: 변동률 범위를 추가하고, 다른 변동 환경에서 다른 파라미터 설정을 사용합니다.
  2. 신호 최적화: 트랜지스 양 확인을 추가하여 돌파 신호의 신뢰성을 높이는 것을 고려할 수 있다.
  3. 스톱 스톱 손실 최적화: 동적으로 조정할 수 있는 이익 손실 비율, 시장의 변동성에 따라 조정 목표.
  4. 시간 필터링: 불리한 시간에 거래하는 것을 피하기 위해 거래 시간 창 필터를 추가하십시오.
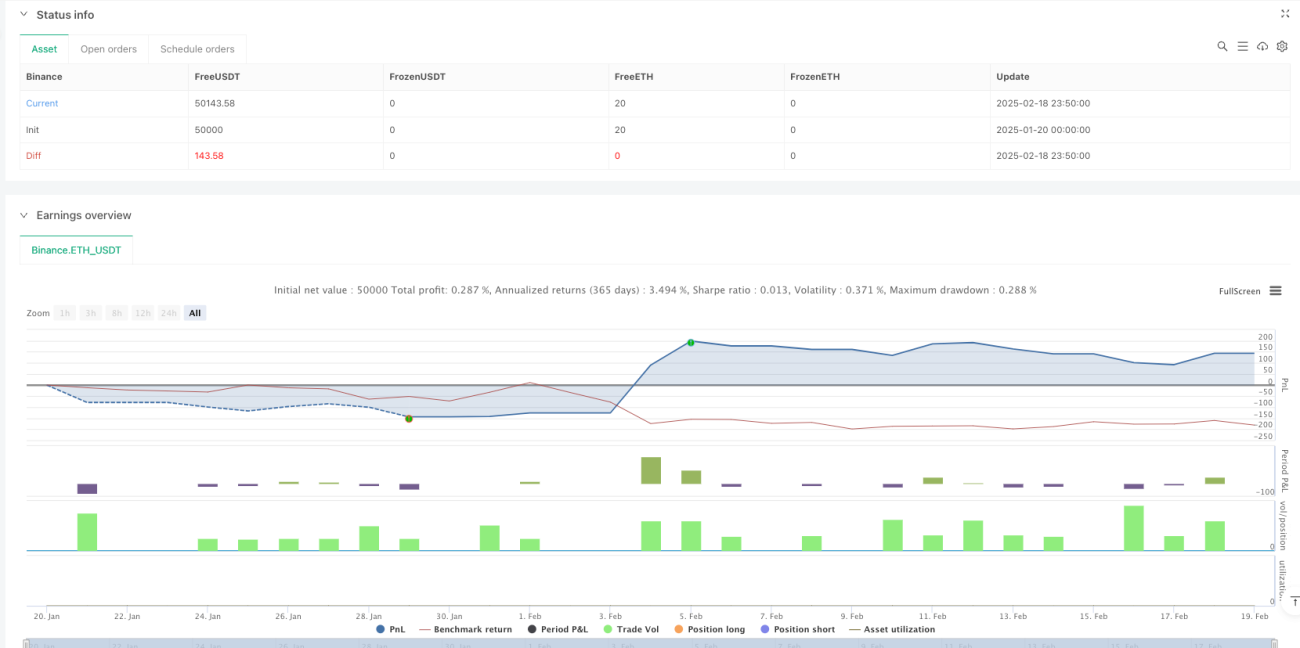
요약하다

이것은 구조적이고 논리적으로 명확한 양적 거래 전략이다. 변동률의 돌파구, 트렌드 추적 및 동력 확인을 결합하여 위험을 제어하면서 눈에 띄는 가격 변동을 포착한다. 전략은 커스터마이징성이 강하여 다른 거래 품종과 시장 환경에 맞게 추가적으로 최적화 할 수 있습니다.

전략 소스 코드
/*backtest
start: 2025-01-20 00:00:00
end: 2025-02-19 00:00:00
period: 10m
basePeriod: 10m
exchanges: [{"eid":"Binance","currency":"ETH_USDT"}]
*/

//@version=5
// Volatility Momentum Breakout Strategy
//
// Description:
// This strategy is designed to capture significant price moves by combining a volatility breakout method
// with a momentum filter. Volatility is measured by the Average True Range (ATR), which is used to set dynamic
// breakout levels. A short‑term Exponential Moving Average (EMA) is applied as a trend filter, and the Relative
// Strength Index (RSI) is used to help avoid entries when the market is overextended.
// 
// Signal Logic:
// • Long Entry: When the current close is above the highest high of the previous N bars (excluding the current bar)
//   plus a multiple of ATR, provided that the price is above the short‑term EMA and the RSI is above 50.
// • Short Entry: When the current close is below the lowest low of the previous N bars (excluding the current bar)
//   minus a multiple of ATR, provided that the price is below the short‑term EMA and the RSI is below 50.
// 
// Risk Management:
// • Trades are sized to risk 2% of account equity.
// • A stop loss is placed at a fixed ATR multiple away from the entry price.
// • A take profit target is set to achieve a 1:2 risk‑reward ratio.
// 
// Backtesting Parameters:
// • Initial Capital: $10,000
// • Commission: 0.1% per trade
// • Slippage: 1 tick per bar
//
// Disclaimer:
// Past performance is not indicative of future results. This strategy is experimental and provided solely for educational
// purposes. Always backtest and paper trade before any live deployment.
//
// Author: [Your Name]
// Date: [Date]

strategy("Volatility Momentum Breakout Strategy", overlay=true, initial_capital=10000, default_qty_type=strategy.percent_of_equity, default_qty_value=5, commission_type=strategy.commission.percent, commission_value=0.1, slippage=1)

// ─── INPUTS ─────────────────────────────────────────────────────────────
atrPeriod       = input.int(14, "ATR Period", minval=1)
atrMultiplier   = input.float(1.5, "ATR Multiplier for Breakout", step=0.1)
lookback        = input.int(20, "Breakout Lookback Period", minval=1)
emaPeriod       = input.int(50, "EMA Period", minval=1)
rsiPeriod       = input.int(14, "RSI Period", minval=1)
rsiLongThresh   = input.float(50, "RSI Long Threshold", step=0.1)
rsiShortThresh  = input.float(50, "RSI Short Threshold", step=0.1)

// Risk management inputs:
riskPercent     = input.float(2.0, "Risk Percent per Trade (%)", step=0.1) * 0.01   // 2% risk per trade
riskReward      = input.float(2.0, "Risk-Reward Ratio", step=0.1)                    // Target profit is 2x risk
atrStopMult     = input.float(1.0, "ATR Multiplier for Stop Loss", step=0.1)         // Stop loss distance in ATRs

// ─── INDICATOR CALCULATIONS ───────────────────────────────────────────────
atrVal   = ta.atr(atrPeriod)
emaVal   = ta.ema(close, emaPeriod)
rsiVal   = ta.rsi(close, rsiPeriod)

// Calculate breakout levels using the highest high and lowest low of the previous N bars,
// excluding the current bar (to avoid look-ahead bias).
highestHigh = ta.highest(high[1], lookback)
lowestLow   = ta.lowest(low[1], lookback)

// Define breakout thresholds.
longBreakoutLevel  = highestHigh + atrMultiplier * atrVal
shortBreakoutLevel = lowestLow  - atrMultiplier * atrVal

// ─── SIGNAL LOGIC ─────────────────────────────────────────────────────────
// Long Entry: Price closes above the long breakout level,
// the close is above the EMA, and RSI > 50.
longCondition = (close > longBreakoutLevel) and (close > emaVal) and (rsiVal > rsiLongThresh)
// Short Entry: Price closes below the short breakout level,
// the close is below the EMA, and RSI < 50.
shortCondition = (close < shortBreakoutLevel) and (close < emaVal) and (rsiVal < rsiShortThresh)

if (longCondition)
    strategy.entry("Long", strategy.long)
if (shortCondition)
    strategy.entry("Short", strategy.short)

// ─── RISK MANAGEMENT ──────────────────────────────────────────────────────
// For each new trade, use the entry price as the basis for stop loss and target calculations.
// We assume the entry price equals the close on the bar where the trade is triggered.
var float longEntryPrice  = na
var float shortEntryPrice = na

// Record entry prices when a trade is opened.
if (strategy.position_size > 0 and na(longEntryPrice))
    longEntryPrice := strategy.position_avg_price
if (strategy.position_size < 0 and na(shortEntryPrice))
    shortEntryPrice := strategy.position_avg_price

// Calculate stop loss and take profit levels based on ATR.
longStop   = longEntryPrice - atrStopMult * atrVal
longTarget = longEntryPrice + (longEntryPrice - longStop) * riskReward
shortStop  = shortEntryPrice + atrStopMult * atrVal
shortTarget= shortEntryPrice - (shortStop - shortEntryPrice) * riskReward

// Issue exit orders if a position is open.
if (strategy.position_size > 0 and not na(longEntryPrice))
    strategy.exit("Long Exit", from_entry="Long", stop=longStop, limit=longTarget)
if (strategy.position_size < 0 and not na(shortEntryPrice))
    strategy.exit("Short Exit", from_entry="Short", stop=shortStop, limit=shortTarget)

// Reset recorded entry prices when the position is closed.
if (strategy.position_size == 0)
    longEntryPrice  := na
    shortEntryPrice := na

// ─── CHART VISUAL AIDS ─────────────────────────────────────────────────────
// Plot the breakout levels and EMA.
plot(longBreakoutLevel, color=color.new(color.green, 0), title="Long Breakout Level", style=plot.style_linebr)
plot(shortBreakoutLevel, color=color.new(color.red, 0), title="Short Breakout Level", style=plot.style_linebr)
plot(emaVal, color=color.blue, title="EMA")

// Optionally, shade the background: green when price is above the EMA (bullish) and red when below.
bgcolor(close > emaVal ? color.new(color.green, 90) : color.new(color.red, 90), title="Trend Background")