동적 비용 평균화 및 유동성 변동을 기반으로 하는 기관 시장 조성자 추적 전략

VWAP CVD DCAA
생성 날짜: 2025-02-20 15:35:17 마지막으로 수정됨: 2025-02-27 17:34:56
복사: 0 클릭수: 425
avatar of ianzeng123 ianzeng123
2
집중하다
319
수행원

동적 비용 평균화 및 유동성 변동을 기반으로 하는 기관 시장 조성자 추적 전략 동적 비용 평균화 및 유동성 변동을 기반으로 하는 기관 시장 조성자 추적 전략

개요

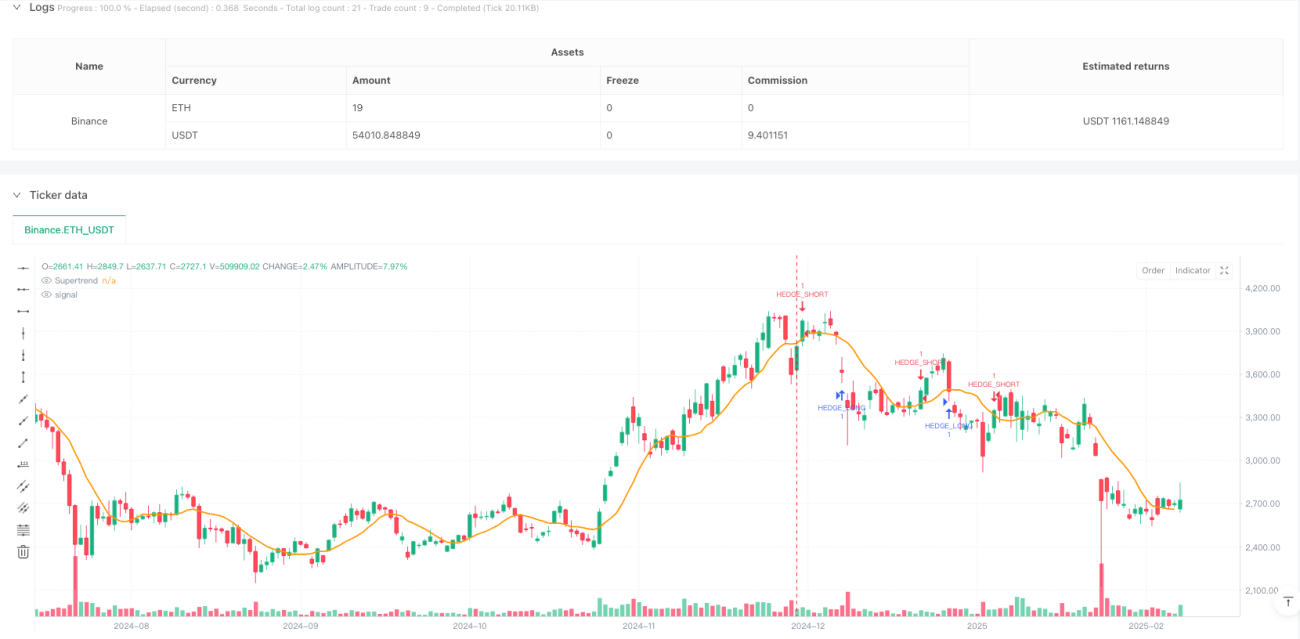
이 전략은 시장의 유동성 지표, 주문서부 불균형 및 시장의 유동성 발자국을 추적하여 높은 확률의 거래 기회를 식별하는 거래 시스템입니다. 이 전략은 동적 비용 평균 (DCAA) 방법을 모아서 리스크를 최소화하고 수익을 극대화하기 위해 변동 유동성 시스템입니다. 이 시스템은 전통적인 기술 지표를 완전히 버리고 기관 수준의 시장 미시 구조 분석에 의존합니다.

전략 원칙

이 전략의 핵심은 다차원적인 데이터를 통해 시장행위를 추적하는 것입니다.

  1. VWAP를 사용하여 매출/배치 위치를 확인합니다.
  2. CVD (累積交量差) 를 통해 다공간 양쪽의 실제 힘 대비를 검출한다.
  3. 유동성 함정 및 유해 사냥 지역을 식별하기 위한 주문서 데이터와 결합
  4. 동적 비용 평균을 통해 중요한 지점에서 배치 창고 시스템을 구축
  5. 시장의 급격한 변동에 대비하여 리스크 관리를 위한 제보 시스템

전략적 이점

  1. 기술 지표의 뒤처짐을 피하는 시장 미시 구조에 전적으로 기반
  2. 시장행동에 대한 분석을 통해 대규모 가격 변동을 미리 예측할 수 있습니다.
  3. 동적비용평균 시스템은 하락시 점진적으로 매장할 수 있어 전체적인 매장비용을 낮출 수 있다.
  4. 헤지 시스템은 특히 시장의 격렬한 변동이 있을 때, 추가적인 위험 보호 층을 제공합니다.
  5. 전략은 정적 지원 저항 지점에 의존하지 않고 실시간으로 시장 조건에 적응할 수 있습니다.

전략적 위험

  1. 실시간 고품질의 시장 데이터가 필요하며 데이터 지연에 민감합니다.
  2. 시장 유동성이 극히 부족한 상황에서 거래 의도를 정확하게 판단하는 것은 어려울 수 있습니다.
  3. 시장행동 분석에 지나치게 의존하는 것은 특정 시장 조건에서 잘못된 판단을 초래할 수 있다.
  4. 동적 비용 평균 시스템은 지속적인 하락 시장에서 큰 손실을 누릴 수 있습니다.
  5. 헤지 전략의 비용은 가로 시장에서 수익을 훼손할 수 있습니다.

전략 최적화 방향

  1. 기계 학습 알고리즘을 도입하여 마케팅 행동 인식의 정확성을 향상시킵니다.
  2. 동적 비용 평균 시스템의 재원 분배 비율을 최적화
  3. 신호 신뢰성을 높이기 위해 시장 미시 구조 지표를 추가합니다.
  4. 적응된 대리율 조정 메커니즘 개발
  5. 특히 극단적인 시장 조건에서 더 나은 위험 제어 시스템을 구축하십시오.

요약하다

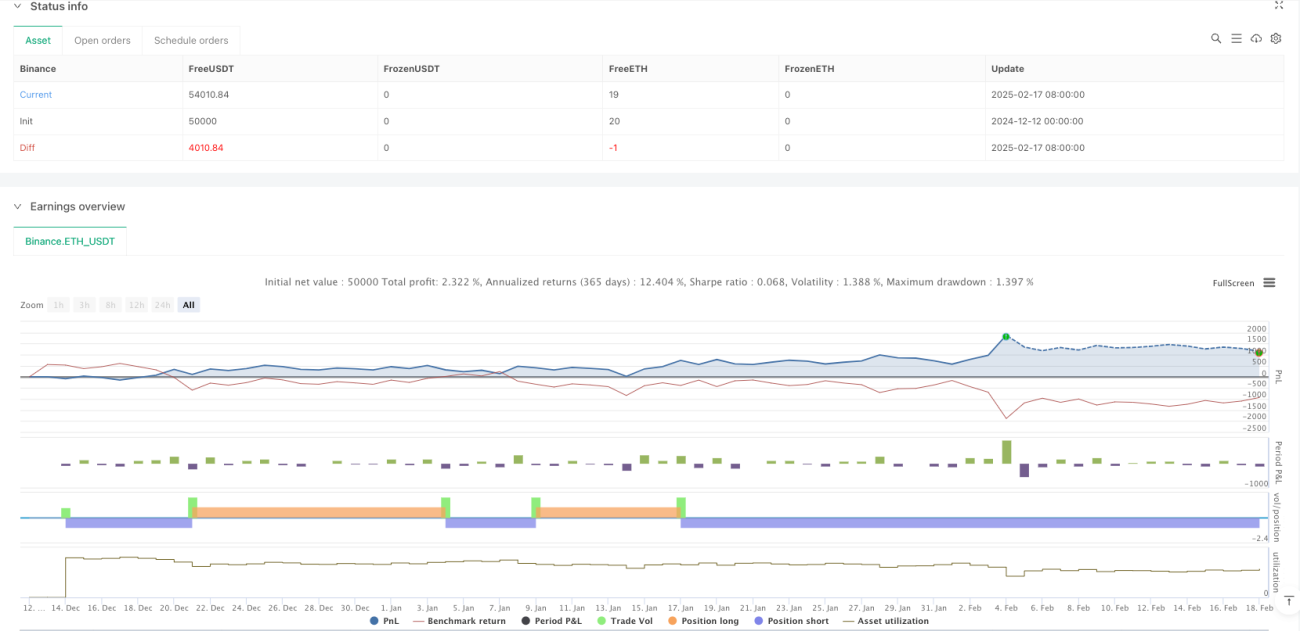
이것은 시장 미시 구조에 기초한 기관 수준의 거래 전략이다. 시장 상인의 행동을 깊이 분석하여 동적 비용 평균과 헤퍼링 시스템을 결합하여 전략은 다양한 시장 환경에서 안정성을 유지할 수 있습니다. 전략의 실행은 기술 및 운영상의 몇 가지 도전을 극복해야하지만, 핵심적인 사고와 방법론은 탄탄한 시장 미시 구조 기반을 가지고 있으며, 장기적으로 안정적인 수익을 올릴 잠재력을 가지고 있습니다.

전략 소스 코드
/*backtest
start: 2024-12-12 00:00:00
end: 2025-02-18 08:00:00
period: 1d
basePeriod: 1d
exchanges: [{"eid":"Binance","currency":"ETH_USDT"}]
*/

//@version=6
strategy("EDGE Market Maker Strategy – DCAA & HedgeFlow", overlay=true)

// ✅ Import Indicators  
vwapLine = ta.vwap
superTrend = ta.sma(close, 10)  // Replace with actual Supertrend formula if needed
volData = volume // Volume from current timeframe
cvdData = ta.cum(close - close[1]) // Approximation of CVD (Cumulative Volume Delta)
orderBlockHigh = ta.highest(high, 20) // Approximate Order Block Detection
orderBlockLow = ta.lowest(low, 20)

// ✅ Market Maker Buy Conditions  
longCondition = ta.crossover(close, vwapLine) and cvdData > cvdData[1] and volData > volData[1]
if longCondition
    strategy.entry("BUY", strategy.long)

// ✅ Market Maker Sell Conditions  
shortCondition = ta.crossunder(close, vwapLine) and cvdData < cvdData[1] and volData > volData[1]
if shortCondition
    strategy.entry("SELL", strategy.short)

// ✅ Order Block Confirmation (For Stronger Signals)  
longOB = longCondition and close > orderBlockHigh
shortOB = shortCondition and close < orderBlockLow

if longOB
    label.new(bar_index, high, "BUY (Order Block)", color=color.green, textcolor=color.white, style=label.style_label_down)

if shortOB
    label.new(bar_index, low, "SELL (Order Block)", color=color.red, textcolor=color.white, style=label.style_label_up)

// ✅ DCAA Levels – Adaptive Re-Entry Strategy  
dcaaBuy1 = close * 0.97  // First re-entry for long position (3% drop)
dcaaBuy2 = close * 0.94  // Second re-entry for long position (6% drop)
dcaaSell1 = close * 1.03 // First re-entry for short position (3% rise)
dcaaSell2 = close * 1.06 // Second re-entry for short position (6% rise)

if longCondition
    strategy.entry("DCAA_BUY_1", strategy.long, limit=dcaaBuy1)
    strategy.entry("DCAA_BUY_2", strategy.long, limit=dcaaBuy2)

if shortCondition
    strategy.entry("DCAA_SELL_1", strategy.short, limit=dcaaSell1)
    strategy.entry("DCAA_SELL_2", strategy.short, limit=dcaaSell2)

// ✅ HedgeFlow System – Dynamic Hedge Adjustments  
hedgeLong = ta.crossunder(close, superTrend) and cvdData < cvdData[1] and volData > volData[1]
hedgeShort = ta.crossover(close, superTrend) and cvdData > cvdData[1] and volData > volData[1]

if hedgeLong
    strategy.entry("HEDGE_LONG", strategy.long)

if hedgeShort
    strategy.entry("HEDGE_SHORT", strategy.short)

// ✅ Take Profit & Stop Loss  
tpLong = close * 1.05  
tpShort = close * 0.95  
slLong = close * 0.97  
slShort = close * 1.03  

strategy.exit("TP_Long", from_entry="BUY", limit=tpLong, stop=slLong)
strategy.exit("TP_Short", from_entry="SELL", limit=tpShort, stop=slShort)

// ✅ Plot VWAP & Supertrend for Reference  
plot(vwapLine, title="VWAP", color=color.blue, linewidth=2)
plot(superTrend, title="Supertrend", color=color.orange, linewidth=2)