
2
Follow
478
Followers
개요
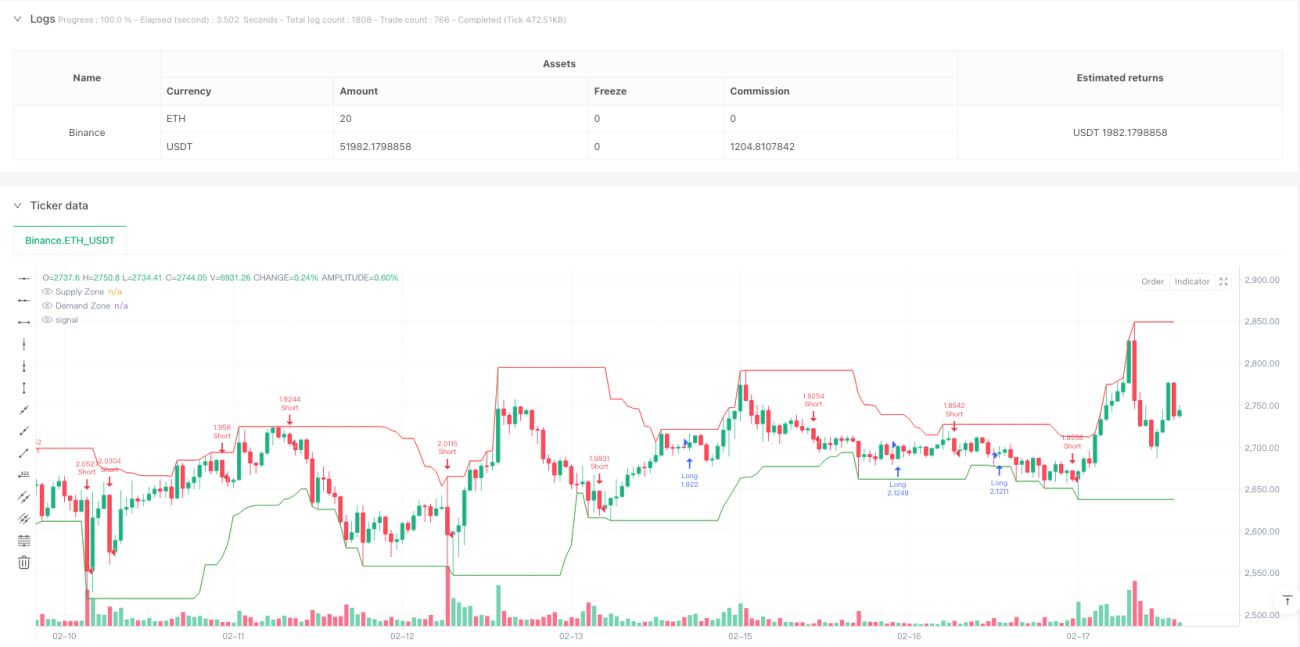
이 전략은 ICT (내부 거래자 개념) 과 흡수 형태 및 수요 지역 분석을 결합한 통합 거래 시스템입니다. 이는 다차원 시장 구조를 분석하여 기술 지표와 가격 행동을 결합하여 높은 확률의 거래 기회를 식별합니다. 이 전략은 15 분 시간 프레임에서 작동하며, 백분율 상쇄를 사용하여 위험을 관리합니다.
전략 원칙
전략의 핵심 논리는 세 가지 주요 구성 요소에 기반합니다.
- 공급과 수요의 영역을 구축하기 위해 20 회의 최고 가격과 최저 가격을 사용하며, 이러한 영역은 중요한 지원과 저항 지점으로 작용한다.
- 부름과 하락의 포식 형태는 인접한 <unk>그램 사이의 관계를 분석하여 식별한다.
- 가격이 수요와 공급 영역을 뚫고 침수되는 경우, 시스템은 위험 관리를 고려하여 거래를 실행한다.
시스템은 매 거래마다 10%의 자금을 사용하며, 1.5%의 스톱로스와 3%의 스톱를 설정하여 2:1의 리스크/이익 비율을 제공합니다.
전략적 이점
- 다차원 분석은 거래 신호의 신뢰성을 높여줍니다.
- 가격 행동과 기술 분석을 결합하여 가짜 신호의 영향을 줄입니다.
- 백분율 상쇄 스톱을 사용하여 시장 조건에 적응
- 자금 관리 시스템이 합리적이고, 매번 10%의 자금이 사용되면 위험도 낮아집니다.
- 다양한 시장 환경에 따라 변수를 조정할 수 있습니다.
전략적 위험
- 높은 변동성이 있는 시장에서 빈번한 손실을 유발할 수 있습니다.
- 공급과 수요 지역을 식별하는 것은 특정 시장 조건에서 정확하지 않을 수 있습니다.
- 15분 시간 프레임은 너무 많은 거래 신호를 생성할 수 있습니다.
- 고정된 스톱 스<unk> 비율은 모든 시장 조건에 적합하지 않을 수 있습니다.
위험 관리 제안:
- 다른 시장 조건에 따라 변수를 조정하는 것이 좋습니다.
- 확인 지표를 추가하는 것을 고려하십시오.
- 변동율에 따라 스톱더스 레벨을 동적으로 조정할 수 있습니다.
전략 최적화 방향
- 변동률 지표의 동적 조정 스톱 스톱 레벨을 도입
- 신호 강도를 확인하기 위해 거래량 분석을 추가합니다.
- 트렌드 필터를 추가하고 역전 거래를 줄이는 것을 고려하십시오.
- 공급 및 수요 지역의 식별 알고리즘을 최적화하여 다중 시간 프레임 분석을 고려할 수 있습니다.
- 시장 상태 인식 기능을 추가하여 다른 시장 조건에 따라 다른 매개 변수 설정을 사용합니다.
요약하다
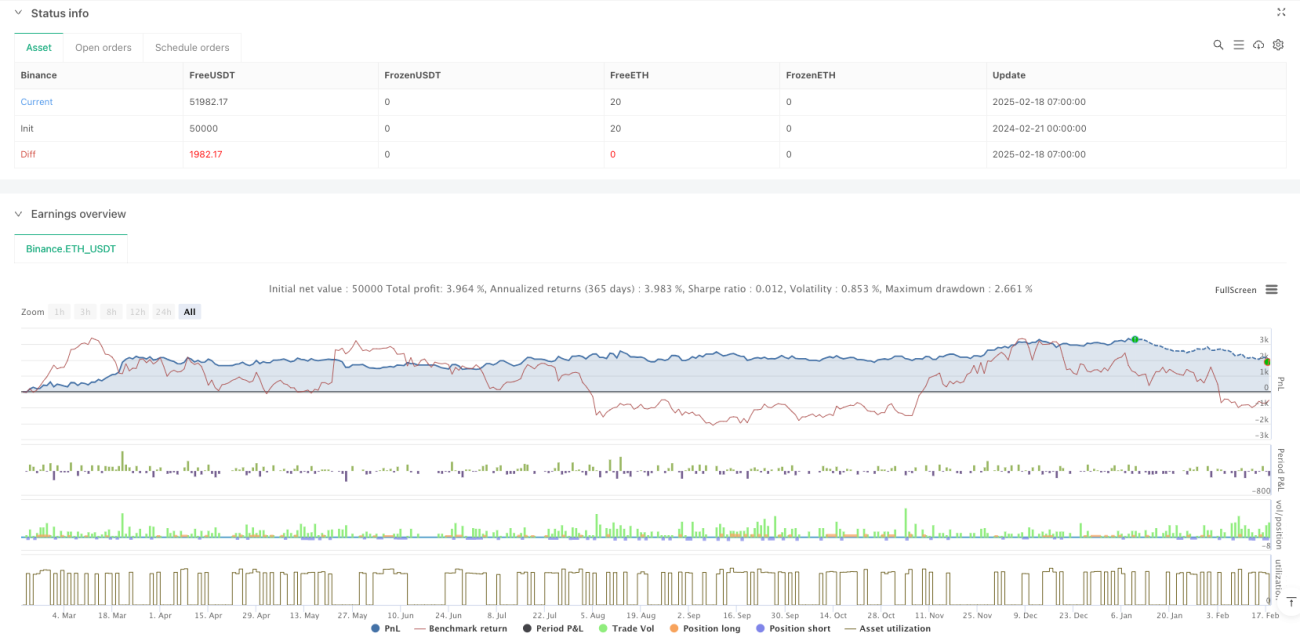
이것은 잘 구성된 종합 거래 시스템으로, 다차원 분석을 통해 신뢰할 수 있는 거래 신호를 제공합니다. 시스템의 위험 관리는 합리적이지만 여전히 최적화 할 여지가 있습니다. 거래자는 실장 사용 전에 충분한 피드백을 수행하고 특정 시장 조건에 따라 매개 변수를 조정하는 것이 좋습니다. 전략의 모듈 디자인은 좋은 확장성을 제공하여 필요에 따라 새로운 분석 차원을 추가 할 수 있습니다.
Source
Pine
/*backtest
start: 2024-02-21 00:00:00
end: 2025-02-18 08:00:00
period: 1h
basePeriod: 1h
exchanges: [{"eid":"Binance","currency":"ETH_USDT"}]
*/

//@version=5
strategy("ICT + Engulfing + Supply & Demand", overlay=true, default_qty_type=strategy.percent_of_equity, default_qty_value=10)

// Input settingsStrategy parameters
Related strategies
Comment
All comments (0)
No data
- 1