
2
Follow
476
Followers
Let me analyze this trading strategy code and create a comprehensive article in both Chinese and English as requested.
개요
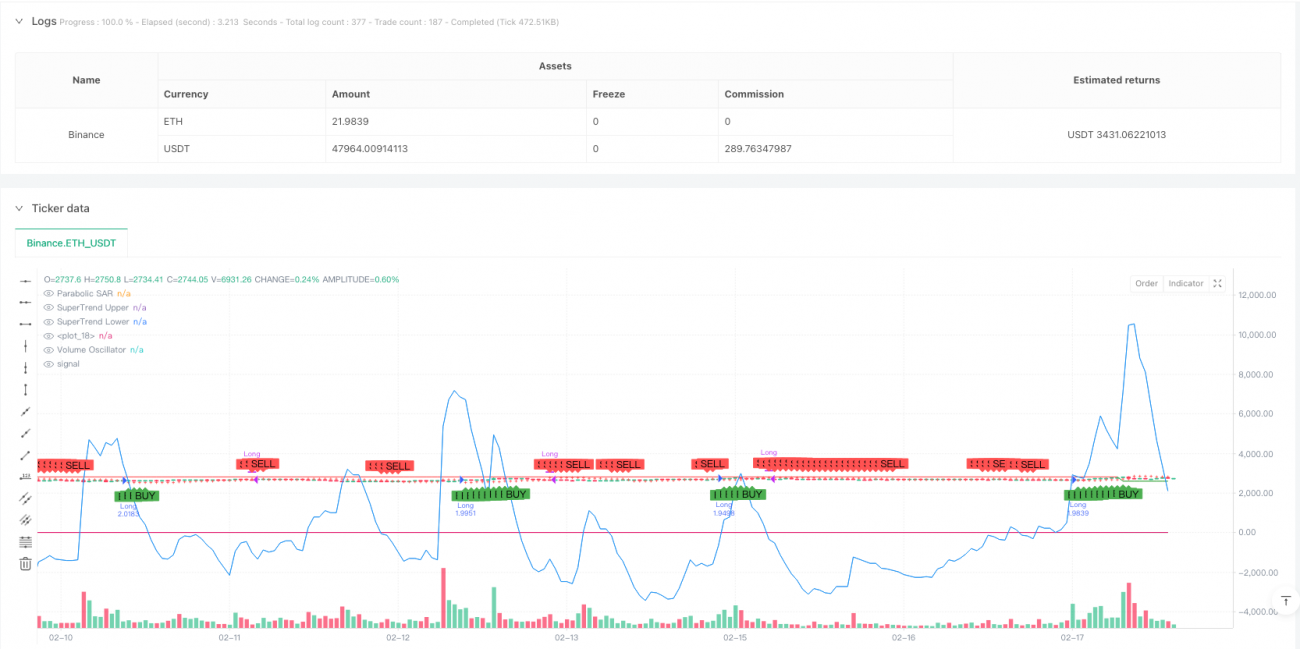
이 전략은 패러블 라인 SAR 지표, 슈퍼 트렌드 지표 및 거래량 진동기 (Volume Oscillator) 를 결합한 통합 거래 시스템이다. 이 전략은 주로 다차원 기술 지표를 통해 시장 추세를 확인하고, 지표 간의 상호 검증을 통해 거래 신호의 신뢰성을 향상시킵니다. 전략 설계의 핵심 아이디어는 경향, 동력 및 거래량의 세 차원에서 신호를 확인하고, 세 차원 모두 일치하는 신호가 발생하는 경우에만 거래한다.
전략 원칙
이 전략은 세 가지 핵심 지표들을 사용했습니다.
- 패러폴리 라인 SAR (초기 값 0.02, 가속 인자 0.02, 최대 값 0.2): 가격 트렌드의 반전점을 식별하기 위해 사용되며, 가격이 SAR 지점 위에 있을 때 상향, 반대로 하향한다.
- 슈퍼 트렌드 ((주기 10, 곱하기 3): ATR 변동률 지표와 결합하여 동적인 트렌드 채널을 생성한다. 가격이 상궤도를 돌파할 때 다중 신호를 생성하고, 하궤도를 돌파할 때 공백 신호를 생성한다.
- 거래량 흔들기 ((단기14, 장기28): 거래량의 단기 및 장기 이동 평균을 비교하여 거래 활동성을 측정합니다. 긍정적 인 값은 거래량이 증가하고 부정적인 값은 거래량이 감소합니다.
거래 신호 생성 논리:
- 다중 조건: 가격 SAR 상위 + SuperTrend 보 ?? (가격 하위 궤도 상위) + 매출량 진동기는 긍정
- 평지 조건: SAR 아래의 가격 + SuperTrend 하락 (상가 상승 아래의 가격) + 거래량 흔들기 마이너스
전략적 이점
- 다차원 확인: 가격 추세, 동적 통로 및 거래량의 3차원 공명으로 거래 신호를 확인하여 가짜 돌파의 위험을 크게 줄입니다.
- 동적 적응: 슈퍼 트렌드 지표는 ATR의 동적 조정으로 채널 폭을 조정하여 다른 시장 변동 환경에 더 잘 적응 할 수 있습니다.
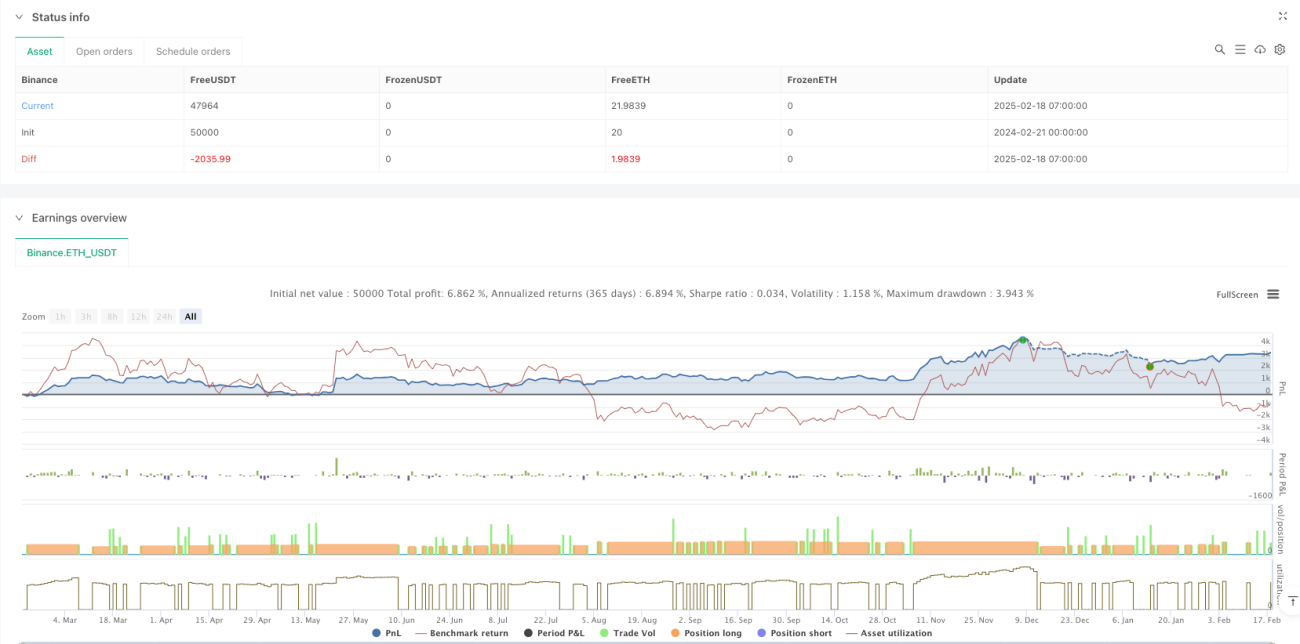
- 위험 제어: 백분율 포지션 관리를 사용하여 (계좌의 순액의 10%로 설정), 각 거래의 위험 경계를 효과적으로 제어한다.
- 시각적 효과: 전략은 SAR 포인트, 트렌드 클라우드 및 거래 신호 표시를 포함한 명확한 시각적 피드백을 제공합니다.
전략적 위험
- 흔들림 시장의 위험: 가로판 흔들림 시장에서 종종 잘못된 신호가 발생할 수 있으며, 이로 인해 연속적인 중단 손실이 발생할 수 있습니다.
- 지연 위험: 여러 가지 이동 평균 형 지표가 사용됨에 따라 신호가 다소 지연되어 최적의 진입 지점을 놓칠 수 있습니다.
- 매개 변수 민감성: 전략 효과는 매개 변수 설정에 민감하며, 다른 시장 환경에는 다른 매개 변수 조합이 필요할 수 있다.
- 비용의 영향: 거래의 빈도는 거래 비용의 증가로 인해 전체 수익에 영향을 미칠 수 있습니다.
전략 최적화 방향
- 시장 환경 필터: 시장 환경 인식 모듈을 추가하여 불안정한 시장에서 자동으로 위치를 낮추거나 거래를 중지하는 것이 좋습니다.
- 동적 변수 최적화: 시장의 변동에 따라 슈퍼 트렌드의 변수를 자동으로 조정하여 전략의 적응력을 향상시킬 수 있습니다.
- 스톱로스 최적화: 트렌드 역전시 수익을 적시에 잠금하는 스톱로스 추적 기능을 추가하는 것이 좋습니다.
- 분기영역 최적화: 서로 다른 거래 시간대의 특성에 따라 신호의 촉발한 절댓값 요구 사항을 조정할 수 있다.
- 비용 통제: 너무 자주 거래되는 것을 방지하기 위해 보유 시간 제한을 높일 수 있습니다.
요약하다
이 전략은 트렌드 추적과 거래량 분석을 결합하여 비교적 완전한 거래 시스템을 구축한다. 전략의 주요 특징은 거래의 신뢰성을 높이기 위해 여러 지표 확인을 사용하는 것과 동시에 시각적 디자인을 통해 거래자에게 직관적인 의사 결정 참고를 제공하는 것이다. 약간의 지연성과 파라미터 감수성 문제가 있지만, 합리적인 최적화 및 위험 제어 조치를 통해 이 전략은 좋은 실용적 가치를 가지고 있다.
Source
Pine
//@version=5
strategy("Parabolic SAR + SuperTrend + Volume Oscillator Strategy", overlay=true, default_qty_type=strategy.percent_of_equity, default_qty_value=10)

// --- Parabolic SAR Parameters ---
sar_start = 0.02
sar_increment = 0.02
sar_max = 0.2
sar = ta.sar(sar_start, sar_increment, sar_max)
plot(sar, color=color.red, style=plot.style_cross, title="Parabolic SAR")

// --- SuperTrend Parameters ---
st_length = 10Related strategies
Comment
All comments (0)
No data
- 1