
2
Follow
475
Followers
개요
이 전략은 다중 기술 지표의 결합 된 정량 거래 시스템입니다. 이동 평균 ((MA), 상대적으로 강한 지표 ((RSI) 및 이동 평균 동향 분산 ((MACD) 의 세 가지 클래식 기술 지표의 협동 조합을 통해 전체적인 거래 신호 시스템을 구축합니다. 전략은 트렌드 추적과 동력 인식이 결합 된 방식을 채택합니다. 거래 방향을 올바르게 보장하는 동시에 기회의 포착에 중점을 둡니다.
전략 원칙
이 전략은 다음의 세 가지 차원에 기반하여 거래 신호를 구성합니다.
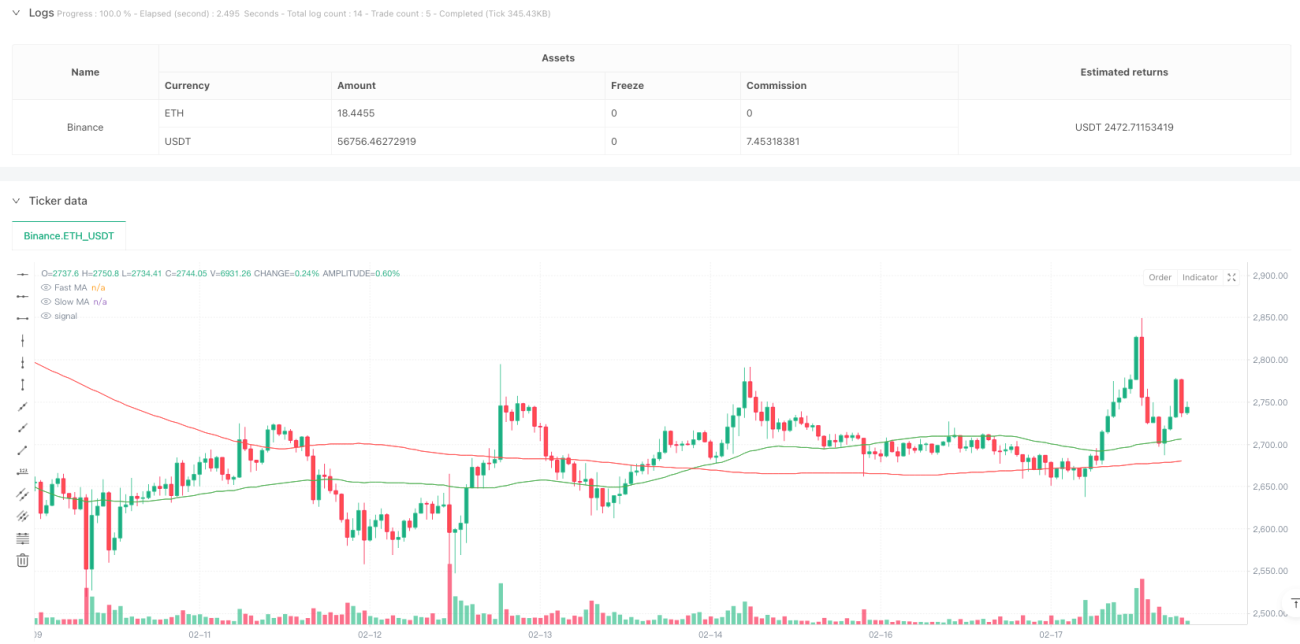
- 추세 판단: 50일과 200일 쌍평선 시스템을 사용하여 금叉死叉을 통해 큰 추세 방향을 판단
- 동력 확인: RSI 과잉 구매 과잉 판매 레벨 ((70/30) 과 MACD 금 포크 사다리, 가격 동력을 확인
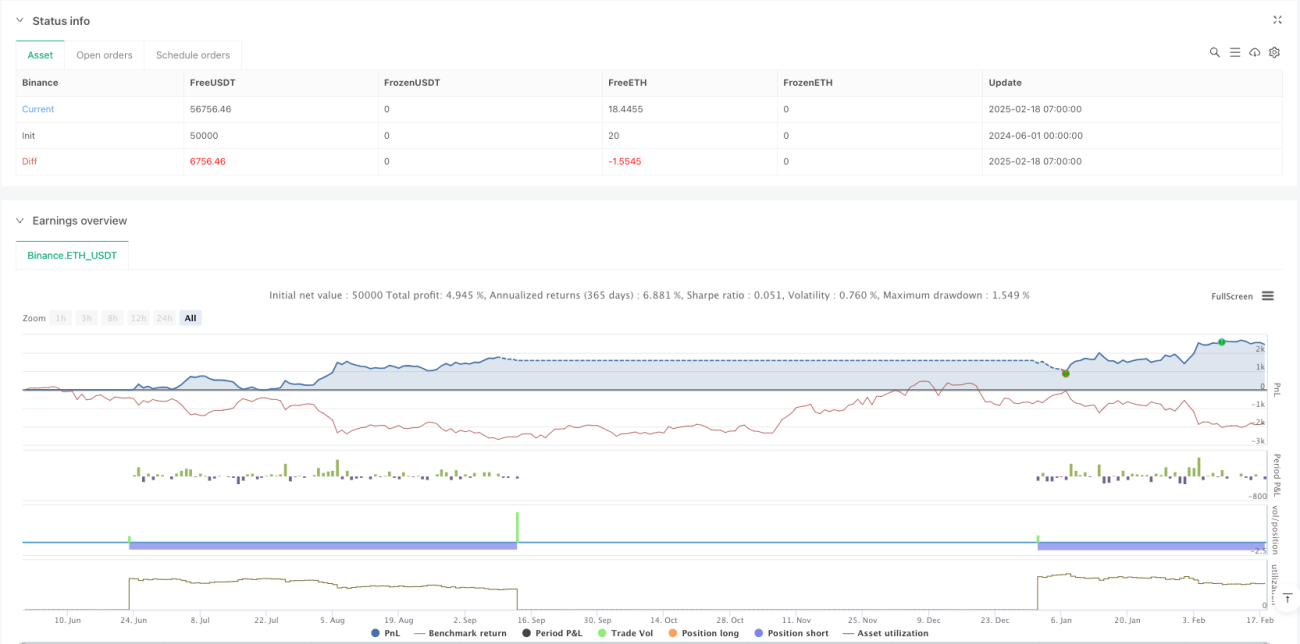
- 위험 관리: 2%의 중지 손실, 4%의 중지 손실 및 1%의 추적 손실을 설정하여 완전한 위험 관리 시스템을 구축합니다.
구체적으로, 빠른 평균선 ((50일) 상에서 느린 평균선 ((200일) 을 뚫고 금포크가 형성될 때, 동시에 RSI가 초매 수준을 달성하지 못하고 MACD가 금포크를 형성할 때, 시스템은 더 많은 신호를 발생시킨다. 반대로, 사각지대가 발생하고 RSI가 초매 수준을 달성하지 못하고 MACD가 사각지대를 형성할 때, 시스템은 공백 신호를 발생시킨다.
전략적 이점
- 신호 신뢰성: 여러 지표의 교차 검증을 통해 가짜 신호를 효과적으로 필터링할 수 있다.
- 트렌드 파악 정확도: 고전적인 쌍방향 시스템을 사용하여 주요 트렌드를 더 잘 포착할 수 있습니다.
- 리스크 관리가 완성: 여러 가지 손해 차단 방법을 통합하여 하향 리스크를 효과적으로 제어
- 적응력: 전략의 매개 변수가 다양하고 다양한 시장 환경에 적응할 수 있습니다.
- 실행 명확: 신호 생성 조건이 명확하고, 주관적 판단으로 인한 간섭을 피한다.
전략적 위험
- 지연 위험: 이동평균선 자체에도 지연이 있으며, 최적의 진입 시점을 놓칠 수 있습니다.
- 위축 시장 위험: 위축 시장에서 종종 가짜 브레이크 신호가 발생할 수 있습니다.
- 매개 변수 최적화 위험: 과도한 최적화 매개 변수는 전략의 안정성에 영향을 미치는 과장 적합성을 초래할 수 있습니다.
- 비용 통제 위험: 자주 거래하는 것은 높은 거래 비용을 초래할 수 있습니다.
- 시장 환경 의존성: 전략이 트렌드가 뚜렷한 시장에서 더 잘 작동하지만 다른 시장 환경에서는 더 좋지 않을 수 있습니다.
전략 최적화 방향
- 교류량 지표 도입: 기존의 신호 시스템에서 교류량을 확인하고 신호 신뢰성을 향상
- 최적화 매개 변수 적응: 매개 변수 동적 조정 메커니즘을 개발하고, 시장에 대한 전략 적응성을 향상
- 시장의 감정 지표를 늘리기: VIX와 같은 감정 지표를 도입하여 진입 시기를 최적화
- 손해 방지 제도를 개선: ATR 기반의 동적 손해 방지와 같은 보다 유연한 손해 방지 제도를 개발
- 변동율 필터를 추가: 높은 변동율 환경에서 포지션을 조정하여 리스크/이익 비율을 최적화
요약하다
이 전략은 여러 기술 지표의 협동 협동으로 비교적 완전한 거래 시스템을 구축한다. 전략은 추세가 뚜렷한 시장에서 잘 작동하지만 실제 시장 상황에 따라 최적화된 조정이 필요하다. 거래자는 실장에서 사용 할 때 먼저 충분한 피드백 검증을 실시하고 자신의 위험 용량에 따라 매개 변수를 조정하는 것이 좋습니다. 전략의 핵심 장점은 체계화된 신호 생성 메커니즘과 완벽한 위험 제어 시스템으로 이루어져 있으며, 이는 실제 실전 응용 가치에 있습니다.
Source
Pine
Strategy parameters
Related strategies
Comment
All comments (0)
No data
- 1