트리플 볼린저 밴드 표준 편차 추세 추종 전략

BB SMA SD RR
생성 날짜: 2025-02-20 16:16:14 마지막으로 수정됨: 2025-02-20 16:16:14
복사: 1 클릭수: 372
avatar of ianzeng123 ianzeng123
2
집중하다
319
수행원

트리플 볼린저 밴드 표준 편차 추세 추종 전략 트리플 볼린저 밴드 표준 편차 추세 추종 전략

개요

이 전략은 부린띠 표준차에 기반한 트렌드 추적 거래 시스템이다. 이 전략은 부린띠의 하향에 대한 위치 관계에 대해 연속적으로 세 개의 선을 관찰함으로써 트렌드의 강도를 판단하고, 트렌드가 확립될 때 거래한다. 이 시스템은 고정된 위험-수익 비율을 사용하여 각 거래의 위험을 관리한다.

전략 원칙

전략의 핵심 논리는 다음과 같은 점에 기초합니다.

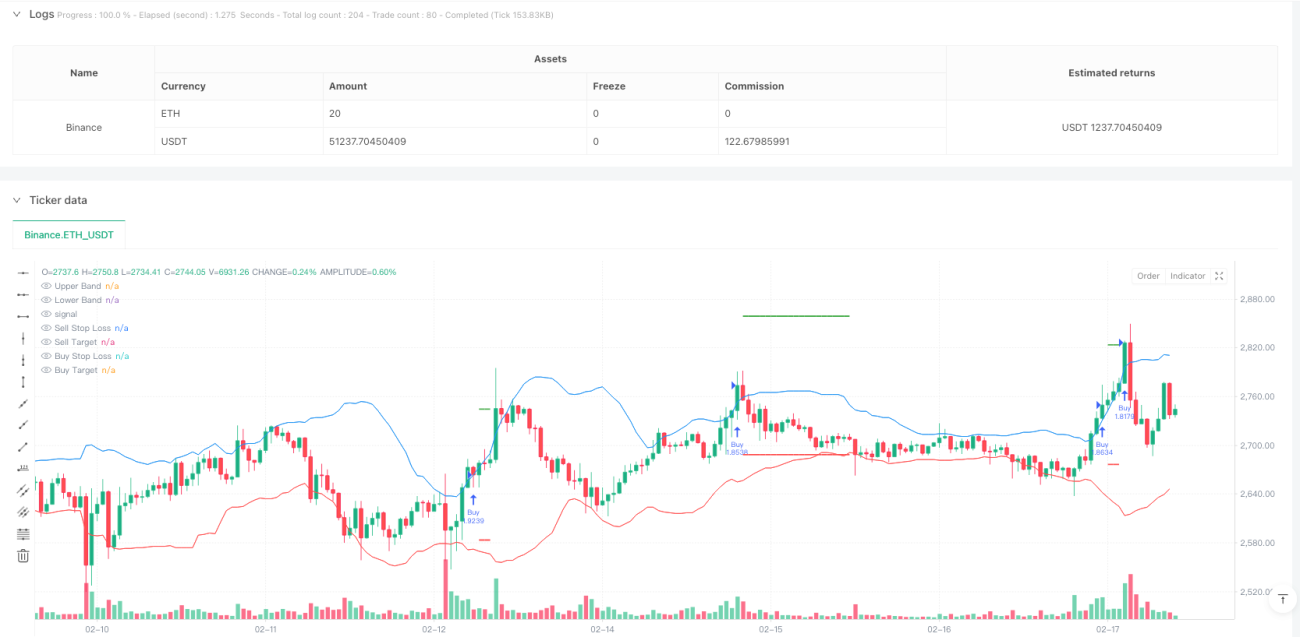
  1. 20주기 이동 평균을 브린띠의 중간 궤도로 사용하며, 2배의 표준차를 이용하여 궤도 상하를 계산한다.
  2. 연속으로 3개의 선에서 종결되는 가격들이 상반기 위에 있을 때, 시스템은 상승 추세가 이미 확립되었다고 생각하고, 3번째 선에서 종결될 때 더 많이 입수한다.
  3. 3개의 연속적인 선의 종결값이 하차선 아래에 있을 때, 시스템은 하향 경향이 확립되었다고 생각하고, 3번째 선 종결시에 입장이 공백된다.
  4. 스톱 손실은 입구 신호의 가장 먼저 라인의 극치에 설정한다.
  5. 목표 가격의 설정은 1:1의 리스크 수익 비율을 채택합니다. 즉, 수익 목표 거리는 중지 손실 거리와 같습니다.

전략적 이점

  1. 신호 확인 메커니즘은 견고하다 - 부린 띠를 3 개의 연속 와이어가 통과하도록 요구되며, 가짜 돌파의 위험을 효과적으로 감소시킨다.
  2. 위험 관리 합리적인 - 고정 위험 수익 비율을 사용하여 거래 관리, 단일 거래의 과도한 손실을 피한다.
  3. 트렌드 추적 효과는 뚜렷하다 - 브린 띠의 표준 차이의 특성으로 전략이 시장의 변동률 변화에 적응할 수 있다.
  4. 실행 규칙이 명확하다 - 입점, 중지 및 수익 목표의 설정에는 주관적인 판단이 필요하지 않은 명확한 수치 기준이 있습니다.

전략적 위험

  1. 수평 시장의 부실한 성과 - 명백한 추세가 없는 시장에서 빈번하게 잘못된 신호가 발생할 수 있다.
  2. 진입시간이 다소 늦어졌기 때문에 3개의 전화 확인을 기다렸다가 진입할 수 있으며, 초기 단계의 진입을 놓칠 수도 있습니다.
  3. 고정 리스크 수익 비율의 제한 - 1: 1의 리스크 수익 비율은 강력한 추세에서 너무 일찍 수익을 얻을 수 있습니다.
  4. 트렌드 강도 필터링의 부재 - 다른 트렌드 확인 지표들을 고려하지 않고, 가격과 브린 띠의 관계에만 의존하는 판단.

전략 최적화 방향

  1. 트렌드 강도 필터를 추가 - ADX 또는 MACD와 같은 트렌드 지표를 도입하여 신호 품질을 향상시킬 수 있습니다.
  2. 최적화된 리스크/이익 비율 설정 - 시장의 변동성에 따라 리스크/이익 비율을 조정할 수 있다.
  3. 정지 메커니즘을 개선하십시오. 이동성 정지 또는 분기성 수익을 증가시키는 메커니즘을 고려하여 큰 트렌드를 더 잘 파악하십시오.
  4. 거래량 확인 추가 - 신호 생성 시 거래량 돌파 확인을 추가하여 신호 신뢰도를 높인다.

요약하다

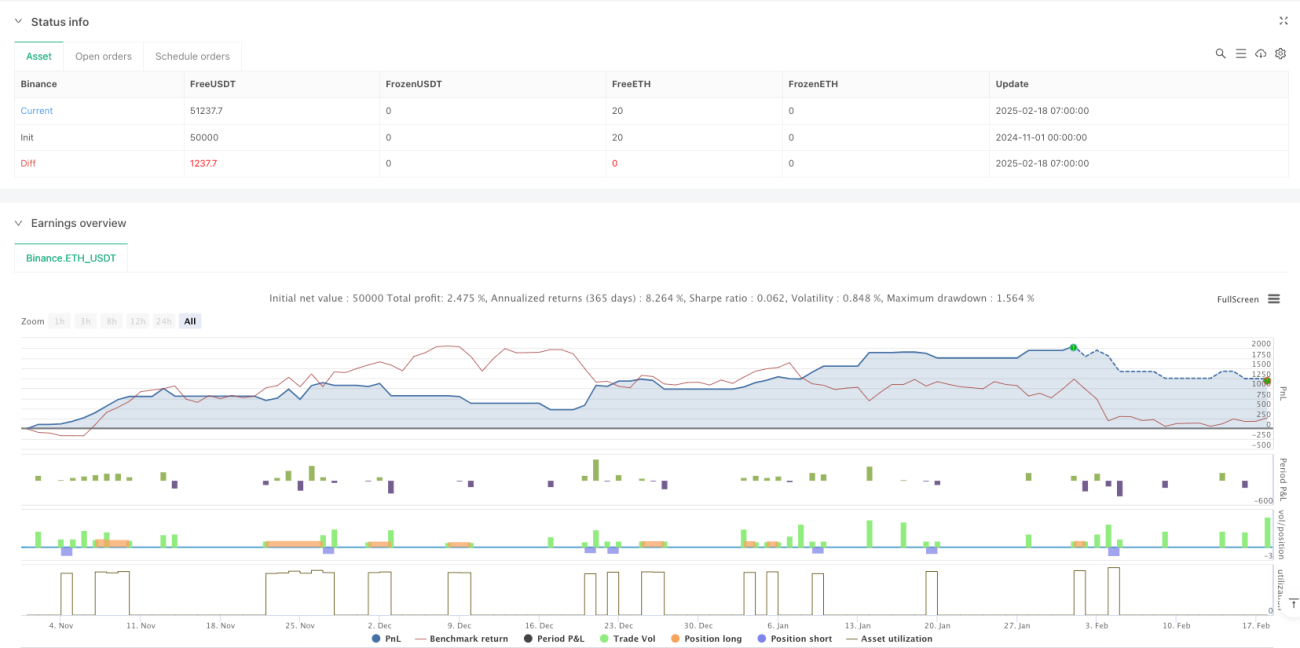
이것은 부린 띠와 여러 확인 메커니즘을 통해 시장 추세를 포착하기 위해 합리적으로 설계된 트렌드 추적 전략입니다. 전략의 위험 관리 프레임 워크가 완성되어 있고, 실행 기준이 명확합니다. 약간의 지연이 있음에도 불구하고, 제안 된 최적화 방향은 전략의 안정성과 수익성을 더욱 향상시킬 수 있습니다.

전략 소스 코드
/*backtest
start: 2024-11-01 00:00:00
end: 2025-02-18 08:00:00
period: 1h
basePeriod: 1h
exchanges: [{"eid":"Binance","currency":"ETH_USDT"}]
*/

//@version=6
strategy("Bollinger Band Buy and Sell Strategy (Entry at Close of 3rd Candle)", overlay=true, default_qty_type=strategy.percent_of_equity, default_qty_value=10, pyramiding=0)

// Bollinger Band settings
length = input.int(20, "Bollinger Band Length")
mult = input.float(2.0, "Standard Deviation Multiplier")
basis = ta.sma(close, length)
dev = mult * ta.stdev(close, length)
upper_band = basis + dev
lower_band = basis - dev

// Plot Bollinger Bands
plot(upper_band, "Upper Band", color.blue)
plot(lower_band, "Lower Band", color.red)

// Initialize variables
var float buyEntryPrice = na
var float buyStopLoss = na
var float buyTargetPrice = na

var float sellEntryPrice = na
var float sellStopLoss = na
var float sellTargetPrice = na

// Buy Condition: Last 3 candles closed above upper band
buyCondition = close[2] > upper_band[2] and 
               close[1] > upper_band[1] and 
               close > upper_band

// Sell Condition: Last 3 candles closed below lower band
sellCondition = close[2] < lower_band[2] and   close[1] < lower_band[1] and   close < lower_band

// Buy Logic
if buyCondition and strategy.position_size == 0
    buyEntryPrice := close  // Entry at the close of the 3rd candle
    buyStopLoss := low[2]   // Low of the earliest candle in the 3-candle sequence
    buyTargetPrice := buyEntryPrice + (buyEntryPrice - buyStopLoss)
    
    strategy.entry("Buy", strategy.long)
    strategy.exit("Buy Exit", "Buy", stop=buyStopLoss, limit=buyTargetPrice)
    
    // Plot buy signal arrow on the entry candle
    label.new(bar_index, low, "▲", color=color.green, style=label.style_label_up, yloc=yloc.belowbar)

// Sell Logic
if sellCondition and strategy.position_size == 0
    sellEntryPrice := close  // Entry at the close of the 3rd candle
    sellStopLoss := high[2]  // High of the earliest candle in the 3-candle sequence
    sellTargetPrice := sellEntryPrice - (sellStopLoss - sellEntryPrice)
    
    strategy.entry("Sell", strategy.short)
    strategy.exit("Sell Exit", "Sell", stop=sellStopLoss, limit=sellTargetPrice)
    
    // Plot sell signal arrow on the entry candle
    label.new(bar_index, high, "▼", color=color.red, style=label.style_label_down, yloc=yloc.abovebar)

// Plot stop loss and target levels for buy trades
plot(strategy.position_size > 0 ? buyStopLoss : na, "Buy Stop Loss", color.red, 2, plot.style_linebr)
plot(strategy.position_size > 0 ? buyTargetPrice : na, "Buy Target", color.green, 2, plot.style_linebr)

// Plot stop loss and target levels for sell trades
plot(strategy.position_size < 0 ? sellStopLoss : na, "Sell Stop Loss", color.red, 2, plot.style_linebr)
plot(strategy.position_size < 0 ? sellTargetPrice : na, "Sell Target", color.green, 2, plot.style_linebr)