
2
Follow
475
Followers
개요
이 전략은 여러 기술 지표가 결합된 트렌드 추적 시스템이다. RSI, MACD, SMA의 교차 신호를 기반으로 거래 방향을 결정하는 동시에 ATR 지표를 사용하여 스톱로스 및 수익 수준을 동적으로 조정한다. 이 전략은 충분한 시장 유동성에서 거래되는 것을 보장하기 위해 거래량 필터를 통합하고, 자금 관리를 최적화하기 위해 일부 스톱 메커니즘을 사용합니다.
전략 원칙
이 전략은 트레이드 신호를 확인하기 위해 3차 확인을 사용합니다.
- 50와 200 일간 평균선의 위치 관계를 통해 주요 트렌드 방향을 판단
- RSI를 이용해 오버 바이 오버 셀 영역의 교차로에서 진입 시점을 찾아보세요
- MACD 지표와 결합하여 트렌드 동력을 확인
- 거래량 필터를 사용하여 충분한 시장 유동성을 보장합니다.
- ATR 기반의 동적 중지 및 수익 목표 설정
다중 검증의 목적은 가짜 신호를 줄이고 거래의 정확성을 높이는 것이다. 전략은 다중 조건이 충족될 때 ((상향 + RSI에 40 + MACD를 상향으로 + 거래량 확인) 포지션을 개설하고 ATR의 2배를 스톱로스로, 4배를 스톱로 사용한다.
전략적 이점
- 가짜 신호를 줄이기 위한 다중 기술 지표 교차 검증
- 동적인 변동률 중지 장치, 다양한 시장 환경에 적응
- 부분적인 매출을 막는 전략으로, 매출의 일부를 잠금하는 동시에 매출의 일부를 유지합니다.
- 거래량 필터링은 충분한 시장 유동성을 보장합니다.
- 고정 손실, 추적 손실 및 부분 수익을 포함하는 완전한 위험 관리 시스템
전략적 위험
- 다중 지표로 인해 일부 거래 기회를 놓칠 수 있습니다.
- 변동성이 큰 시장에서는 큰 하락을 겪을 수 있습니다.
- 과도한 매개변수 최적화는 과적합으로 이어질 수 있습니다.
- 거래량 필터링은 유동성이 낮은 시장에서 기회를 놓칠 수 있습니다.
- 동적 중지 손실은 높은 변동 기간 동안 조기에 유발 될 수 있습니다.
전략 최적화 방향
- 시장의 변동성에 대한 적응 장치를 고려하여 다양한 변동 환경에서 변수를 동적으로 조정하십시오.
- 트렌드 판단의 정확성을 높이기 위해 다주기 분석을 도입합니다.
- 부분 중단 비율을 최적화하고, 다른 시장 환경에 따라 중단 전략을 조정합니다.
- 트렌드 강도 필터를 추가하여 약한 트렌드 환경에서 거래하는 것을 피하십시오.
- 계절적 요소 분석을 고려하여 거래 시기를 최적화하십시오.
요약하다
이것은 다중 기술 지표의 조합 사용으로 안정적인 거래 시스템을 구축하는 포괄적 인 트렌드 추적 전략입니다. 전략의 주요 특징은 보안을 보장하면서 동적인 중지 및 수익 메커니즘을 통해 시장 변화에 적응하는 것입니다.
Source
Pine
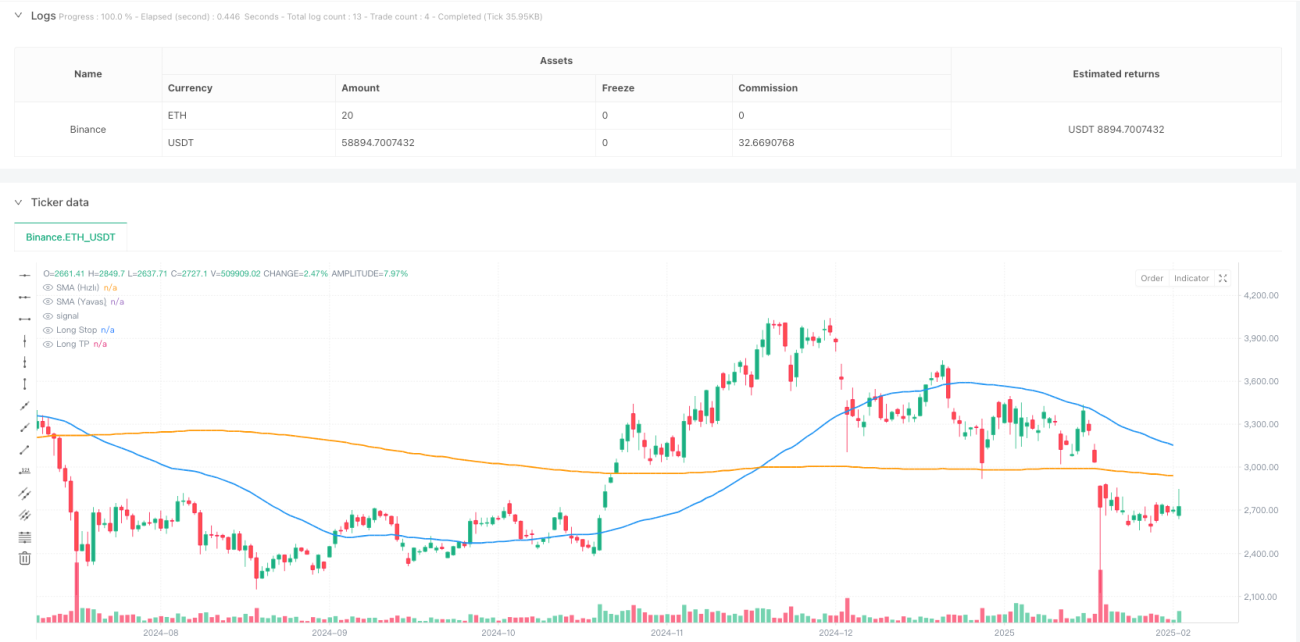
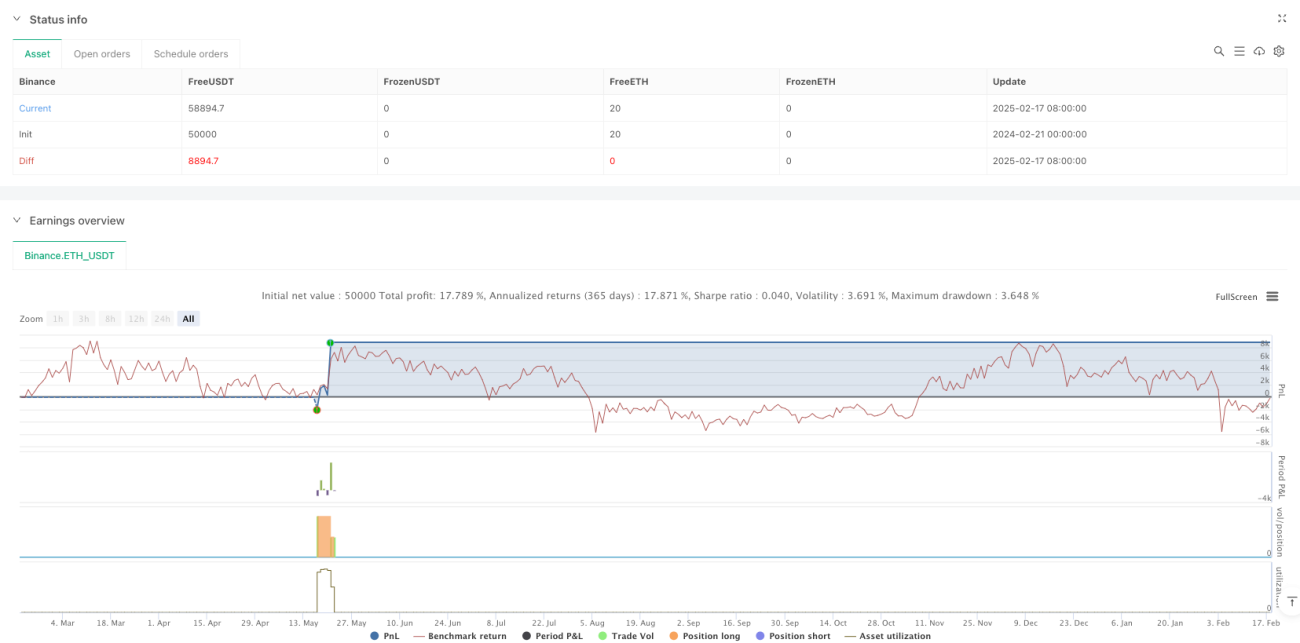
/*backtest
start: 2024-02-21 00:00:00
end: 2025-02-18 08:00:00
period: 1d
basePeriod: 1d
exchanges: [{"eid":"Binance","currency":"ETH_USDT"}]
*/

//@version=5
strategy(    title="AI Trade Strategy v2 (Extended) - Fixed",    shorttitle="AI_Trade_v2",    overlay=true,    format=format.price,    initial_capital=100000,    default_qty_type=strategy.percent_of_equity,    default_qty_value=100,    pyramiding=0)

//============================================================================Strategy parameters
Related strategies
Comment
All comments (0)
No data
- 1