다중 지표 조정 추세 반전 거래 전략: RSI 슈퍼 매수 및 매도 신호와 SAR 지표 및 이동 평균 동적 위험 제어 시스템을 결합

2
Follow
478
Followers
개요
이 전략은 여러 지표의 조화 트렌드 역전 거래 시스템으로, 주로 비교적 약한 지표 ((RSI), 패러폴리 라인 지표 ((SAR) 및 간단한 이동 평균 ((SMA) 의 세 가지 기술 지표를 결합한다. 전략의 핵심 아이디어는 RSI 초상도 신호를 통해 잠재적인 역전 기회를 경고하고, SAR 지표의 방향 변화를 사용하여 역전 신호를 확인하고, 마지막으로 이동 평균을 동적 스톱 손실 참조로 사용한다. 이 여러 지표의 조화 검증 방법은 가짜 신호의 간섭을 효과적으로 줄이고 거래의 신뢰성을 향상시킬 수 있다.
전략 원칙
전략 운영 메커니즘은 크게 3단계로 구성됩니다.
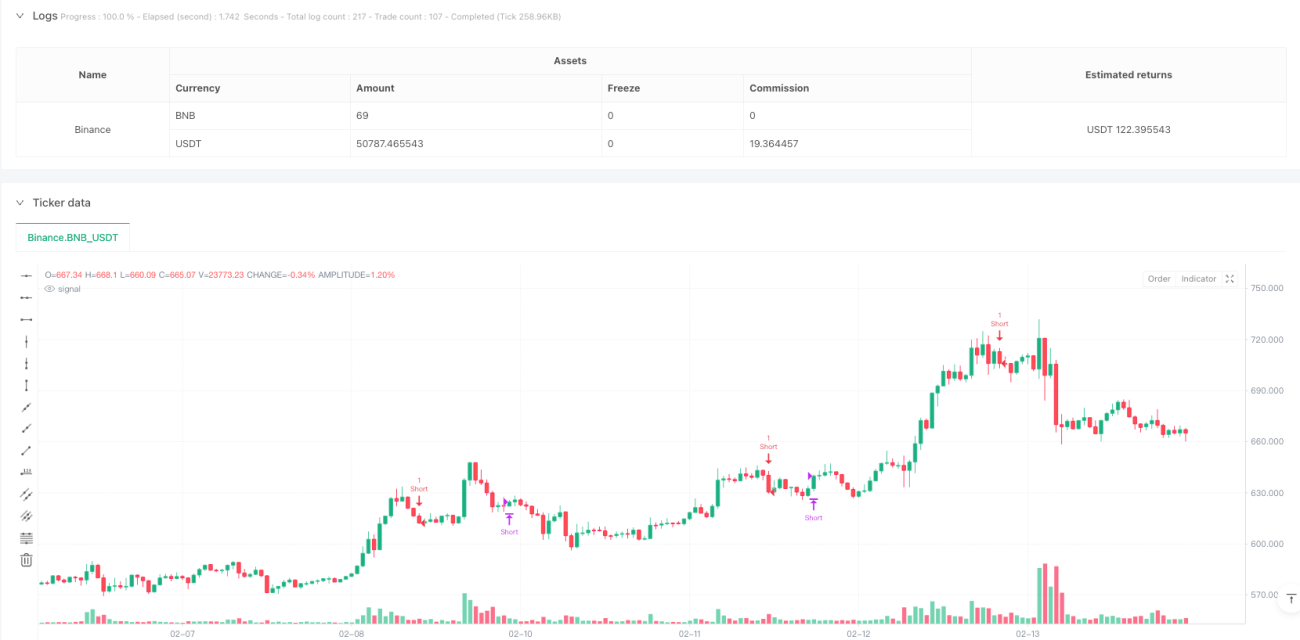
- 신호 경보: RSI 지표가 오버 바이 ((> 70)) 또는 오버 세드 ((< 30) 신호가 발생하는지 모니터링하십시오. 이러한 신호는 가격 반전의 가능성을 예고합니다.
- 입력 확인: RSI 신호가 발신된 후 1-3K선 내에, SAR 지표가 방향이 반전되는 경우에도 입력 신호를 확인합니다. 구체적으로:
- 더 많은 조건: RSI가 오버셀한 후 3개의 K선 안에 SAR가 위에서 아래로 이동
- 공백 조건: RSI 오버 바이 후 3개의 K선 내 SAR 아래에서 위로 이동
- 탈퇴 메커니즘: 21주기 간단한 이동 평균 ((SMA) 을 동적 스톱 스톱 손실 라인으로 사용하여, 가격이 평균선과 교차할 때 평점:
- 다중 평점: 가격 하락 21 평균
- 21평균선을 넘어선 공백상
전략적 이점
- 다중 검증: RSI와 SAR 두 지표의 협동 확인을 통해 가짜 신호를 효과적으로 필터링하여 거래 정확도를 향상시킬 수 있습니다.
- 동적 풍력 제어: 동적 손실 기준으로 이동 평균을 사용하면 수익이 충분히 발전 할 수 있으며 손실을 효과적으로 제어 할 수 있습니다.
- 매개 변수 조정: 전략의 매개 변수 (RSI 주기, 초상도, SAR 매개 변수 등) 는 다른 시장 특성에 따라 최적화 조정 할 수 있습니다.
- 논리 명확성: 입출장 조건이 명확하여 재검토 검증과 실 디스크 동작이 용이하다.
전략적 위험
- 위기 시장 위험: RSI와 SAR는 수평 위기 상황에서 자주 반전 신호를 발산하여 과다 거래가 발생할 수 있습니다.
- 슬라이드 포인트 영향: 시장이 급격하게 변동할 때, 평평선을 상쇄점으로 삼아 큰 슬라이드 포인트에 직면할 수 있다.
- 매개 변수 민감성: 전략 효과는 매개 변수 설정에 민감하며, 다른 시장 환경에는 다른 매개 변수 조합이 필요할 수 있다.
- 가짜 브레이크 위험: 가격이 평균선을 넘으면 가짜 브레이크가 발생하여 불필요한 손실이 발생할 수 있습니다.
전략 최적화 방향
- 시장 환경 식별: 트렌드 강도 지표 (ADX와 같은) 를 추가하여, 흔들리는 시장에서 거래 빈도를 줄이거나 거래를 중지할 수 있다.
- 스톱 손실 최적화: 평행선 기반에서 일정 공간을 추가하거나, ATR과 함께 스톱 손실 거리를 동적으로 조정할 수 있다.
- 포지션 관리: 신호 강도 및 시장 변동률에 따라 포지션 규모를 조정할 수 있다.
- 시간 필터: 거래 시간 창의 제한을 증가시켜 유동성이 낮은 시기를 피할 수 있다.
- 신호 강도 등급: RSI와 SAR 신호의 다른 조합에 따라 다른 거래 무게를 설정할 수 있다.
요약하다
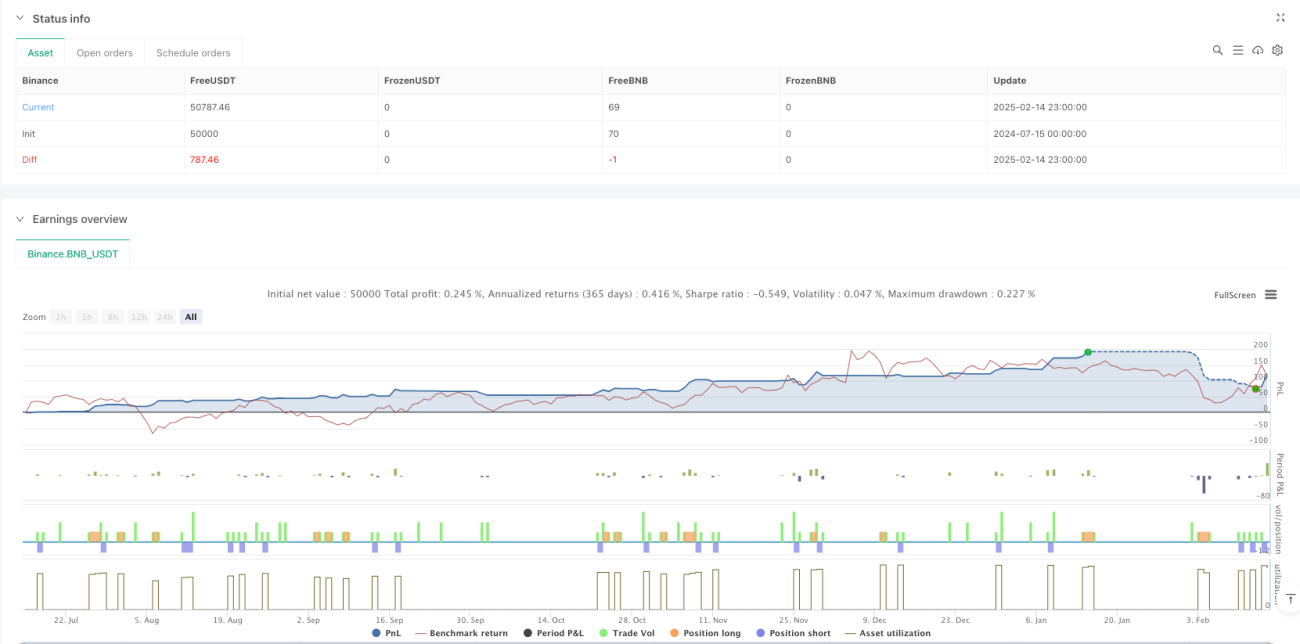
이 전략은 RSI와 SAR의 협동 협력을 통해 비교적 신뢰할 수 있는 트렌드 역전 거래 시스템을 구축한다. 이동 평균을 동적 위험 관리 도구로 사용하여 트렌드를 효과적으로 파악하는 것은 물론 위험의 동적 통제를 실현한다. 전략의 주요 장점은 다중 신호 검증과 명확한 거래 규칙에 있다. 그러나 실제 응용에서는 시장 환경의 식별과 매개 변수의 동적 최적화에 주의를 기울여야 한다. 시장 환경 필터를 추가하고, 손실을 중지하는 방법을 최적화하고, 포지션 관리와 같은 방향을 개선함으로써 전략의 안정성과 수익성을 더욱 향상시킬 수 있다.
Source
Pine
Strategy parameters
Related strategies
Comment
All comments (0)
No data
- 1