
2
Follow
475
Followers
개요
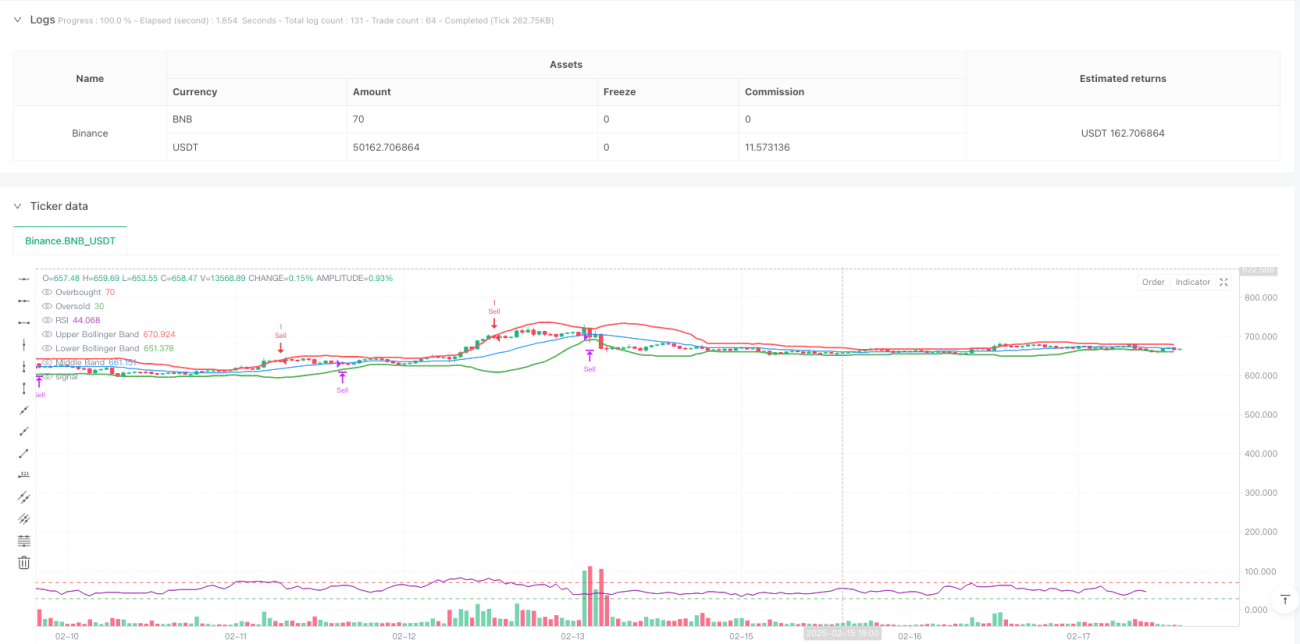
이 전략은 부린 밴드 (Bollinger Bands) 와 상대적으로 약한 지표 (RSI) 를 결합한 기술 분석 거래 시스템이다. 그것은 주로 가격 변동과 시장 동력의 특성을 활용하여 오버 바이 오버 셀 영역에서 거래 기회를 찾는다. 이 전략은 RSI 지표가 오버 바이 (Bollinger Bands) 를 표시하고 오버 세일 영역을 넘어가는 경우 구매 신호를 발생시킨다.
전략 원칙
전략의 핵심 논리는 다음과 같은 핵심 요소에 기초합니다.
- 브린 벨트 파라미터 설정은 20주기 이동 평균을 중도로 사용하고, 표준 차이의 배수는 2.0이다.
- RSI 매개 변수는 전통적인 14주기 설정을 사용합니다.
- 입장 조건:
- 구매: 가격 상승 부린이 하락하고 RSI <30
- 판매: 가격 하향 부린을 돌파하고 RSI>70
- 출구 조건: 가격과 브린 벨트 중간 궤도 ((20주기 이동 평균) 가 교차할 때 평점
이 조합은 가격의 통계적 특성을 고려하고 동력 지표와 결합하여 거래의 정확성을 효과적으로 향상시킵니다.
전략적 이점
- 다중 확인 메커니즘: 가격과 동력 지표의 결합으로 잘못된 신호를 줄여줍니다.
- 리스크 관리가 합리적입니다: 브린 벨트 중철을 스톱포인트로 사용하여 수익을 보호하고 위험을 통제합니다.
- 적응력: 시장의 변동에 따라 부린밴드가 자동으로 대역폭을 조정합니다.
- 매개 변수 설정 클래식: 광범위한 검증 된 매개 변수 조합을 사용하여 전략 안정성을 향상시킵니다.
- 논리 명확성: 거래 규칙이 명확하여 재검토와 실장 작업을 용이하게 합니다.
전략적 위험
- 위기 시장 위험: 수평 시장에서 자주 거래 신호가 발생할 수 있습니다.
- 트렌드 시장 위험: 강세를 보인 시장의 일부가 놓칠 수 있습니다.
- 매개 변수 민감성: 브린 밴드 주기 및 RSI 설정이 전략 성과에 큰 영향을 미칩니다.
- 슬라이드 포인트 영향: 가격의 급격한 변동으로 인해 더 큰 슬라이드 포인트가 발생할 수 있습니다.
위험 관리를 위해 다음과 같은 조치가 권장됩니다.
- 적절한 포지션 컨트롤을 설정
- 트렌드 필터 추가
- 최적화 매개 변수 적응 메커니즘
- 거래비용을 고려하여 재검토
전략 최적화 방향
- 동적 매개변수 최적화:
- 시장의 변동에 따라 부린 대역변수 조정
- RSI 하락값은 시장 상황에 따라 조정됩니다.
- 부수적인 지표를 추가합니다.
- 수량 확인
- 트렌드 지표를 필터로 고려하세요.
- 손절매 메커니즘 개선:
- 트래킹 중지
- 최대 손실 한도를 설정하세요
- 거래 실행을 최적화합니다.
- 일부 포지션 거래
- 입시 가격 최적화 논리를 추가합니다.
요약하다
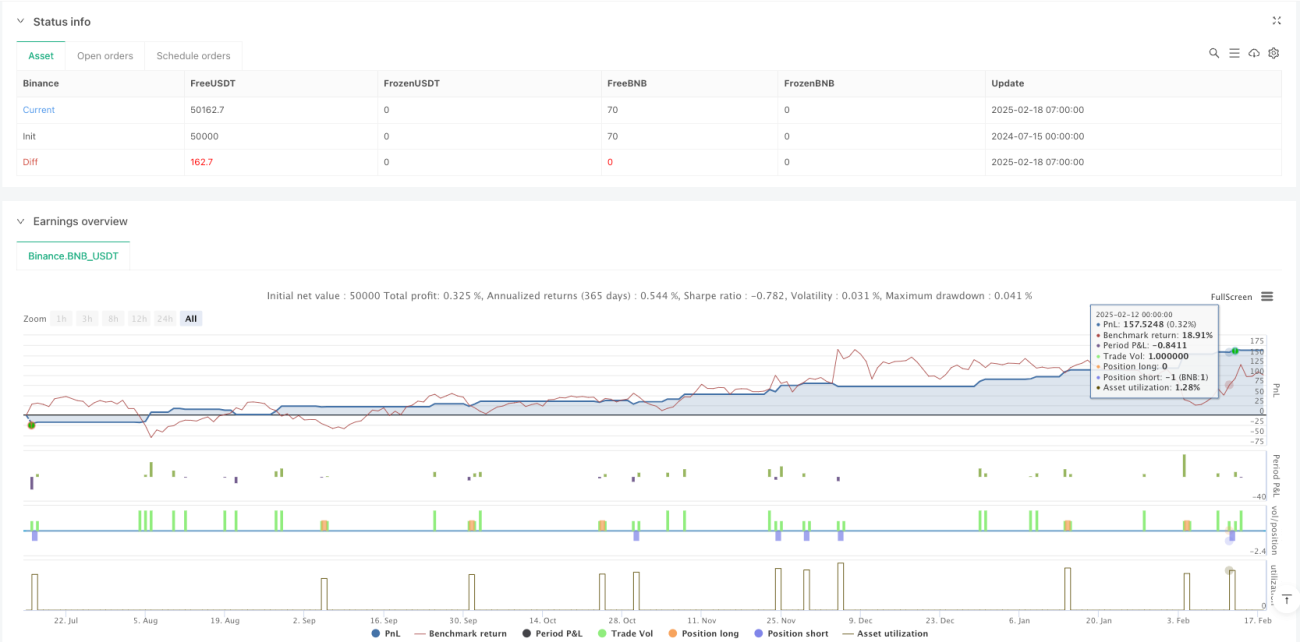
이 전략은 브린띠와 RSI 지표를 결합하여 비교적 완전한 거래 시스템을 구축한다. 전략의 논리는 명확하고, 위험 통제는 합리적이며, 실용적인 가치가 있다. 제안된 최적화 방향에 의해, 전략에는 더 이상의 향상시킬 여지가 있다. 실제 적용에서, 투자자는 자신의 위험 용량과 시장 환경에 따라 적절한 조정을 하도록 권장한다.
Source
Pine
Strategy parameters
Related strategies
Comment
All comments (0)
No data
- 1