피보나치 수정과 손절매 및 손절매 최적화 시스템을 결합한 다중 지표 교차 추세 추적 전략

2
Follow
478
Followers
개요
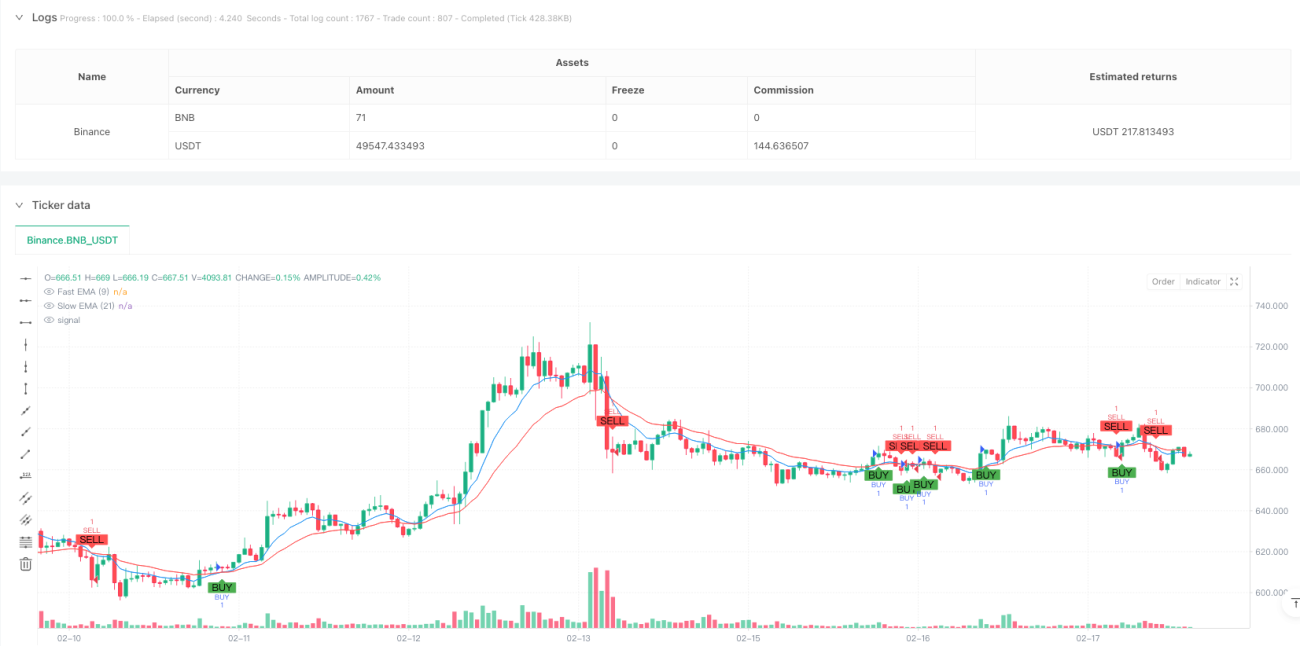
이 전략은 지수 이동 평균 (EMA) 교차, 피보나치 회귀 레벨, 트렌드 판단 및 스톱 스로프 메커니즘을 결합한 통합 거래 시스템이다. 이 전략은 9주기 및 21주기 EMA의 교차를 통해 거래 신호를 결정하며, 피보나치 회귀 레벨과 결합하여 진입 지점을 최적화하고, 실시간 트렌드 상태 모니터링을 통해 거래의 정확성을 향상시킵니다. 이 시스템은 또한 백분율 스톱 스로프 메커니즘을 통합하여 위험을 효과적으로 제어합니다.
전략 원칙
전략의 핵심 논리는 다음과 같은 핵심 요소에 기초합니다.
- 빠른 EMA ((9주기) 가 느린 EMA ((21주기) 를 상향으로 통과하면, 시스템은 다중 신호를 생성한다.
- 빠른 EMA가 느린 EMA를 아래로 통과하면 시스템이 공백 신호를 냅니다.
- 100주기의 최고 가격과 최저 가격을 계산하여 23.6%, 38.2%, 50% 및 61.8%의 피보나치 리커딩 수준을 도출합니다.
- 현재 트렌드 상태를 판단하기 위한 방법
- 거래가 실행될 때, 시스템은 자동으로 고정된 비율의 정지위치 ((4%) 와 정지위치 ((2%) 를 설정합니다.
전략적 이점
- 다차원 신호 확인: EMA 교차, 피보나치 레벨 및 트렌드 상태를 결합하여 더 신뢰할 수 있는 거래 신호를 제공합니다.
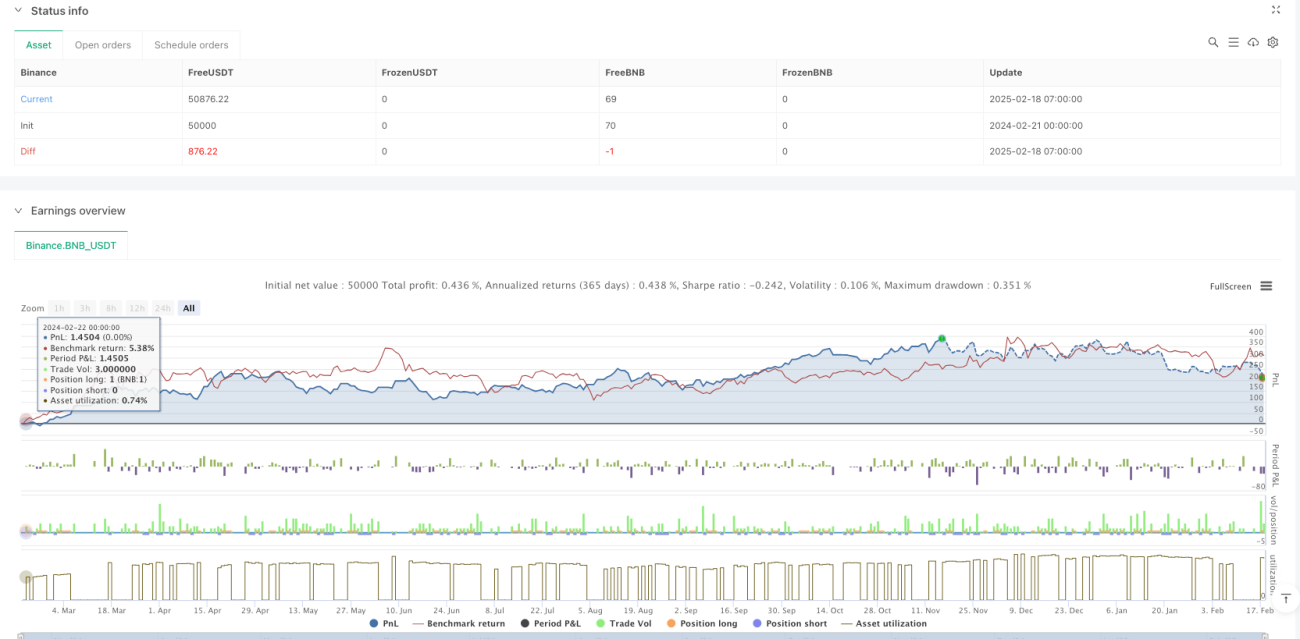
- 리스크 관리가 완벽합니다: 미리 설정된 스톱 스톱 손실 비율을 통해 자동화된 리스크 관리를 구현합니다.
- 트렌드 추적 능력: EMA 교차 결합 트렌드 상태 판단, 시장 트렌드를 효과적으로 캡처 할 수
- 명확한 시각적 피드백: 중요한 가격 수준, 트렌드 상태 및 거래 신호를 표시하는 태그를 통해 거래 결정을 쉽게합니다.
- 높은 체계화: 거래 논리가 명확하고 주관적 판단의 방해가 적다
전략적 위험
- 오징어 시장 위험: 수평 정리 단계에서 EMA가 자주 교차하면 잘못된 신호가 발생할 수 있습니다.
- 뒤떨어진 위험: 이동 평균은 본질적으로 뒤떨어진 지표이며, 최고의 진입 시기를 놓칠 수 있습니다.
- 고정된 손실 위험: 모든 시장 환경에 적합하지 않을 수 있는 고정된 손실 비율
- 신호 충돌 위험: 여러 지표들 사이에 모순된 신호가 발생할 수 있으며, 의사결정이 어려워질 수 있습니다.
- 시장 변동 위험: 급격한 변동으로 인해 상식적인 스톱포트가 발생할 수 있습니다.
전략 최적화 방향
- 동적 스톱 로드 최적화: ATR 또는 시장 변동률에 따라 동적으로 스톱 로드 거리를 조정할 수 있습니다.
- 신호 필터링 강화: 교통량, 동력 등 보조 지표를 증가시켜 가짜 신호를 필터링한다
- 매개 변수 자조: 시장 상태의 동적으로 EMA 주기를 조정하는 자조 메커니즘을 도입
- 입시 최적화: 가격 형태와 거래량과 결합하여 피보나치 수준 근처에 입시 최적화
- 포지션 관리: 변동성 및 계정 리스크를 기반으로 설계된 역동적인 포지션 관리 시스템
요약하다
이 전략은 여러 클래식 기술 분석 도구를 통합하여 보다 완전한 거래 시스템을 구축한다. 이 전략의 장점은 신호 확인의 다차원성과 위험 관리의 체계화이다. 그러나 여전히 다양한 시장 환경에 맞게 최적화를 필요로 한다. 거래자는 실제 시장에서 적용할 때, 시장의 구체적인 상황에 따라 파라미터를 최적화 조정하고 항상 위험에 대한 경각심을 유지하도록 권장한다.
Source
Pine
Strategy parameters
Comment
All comments (0)
No data
- 1