
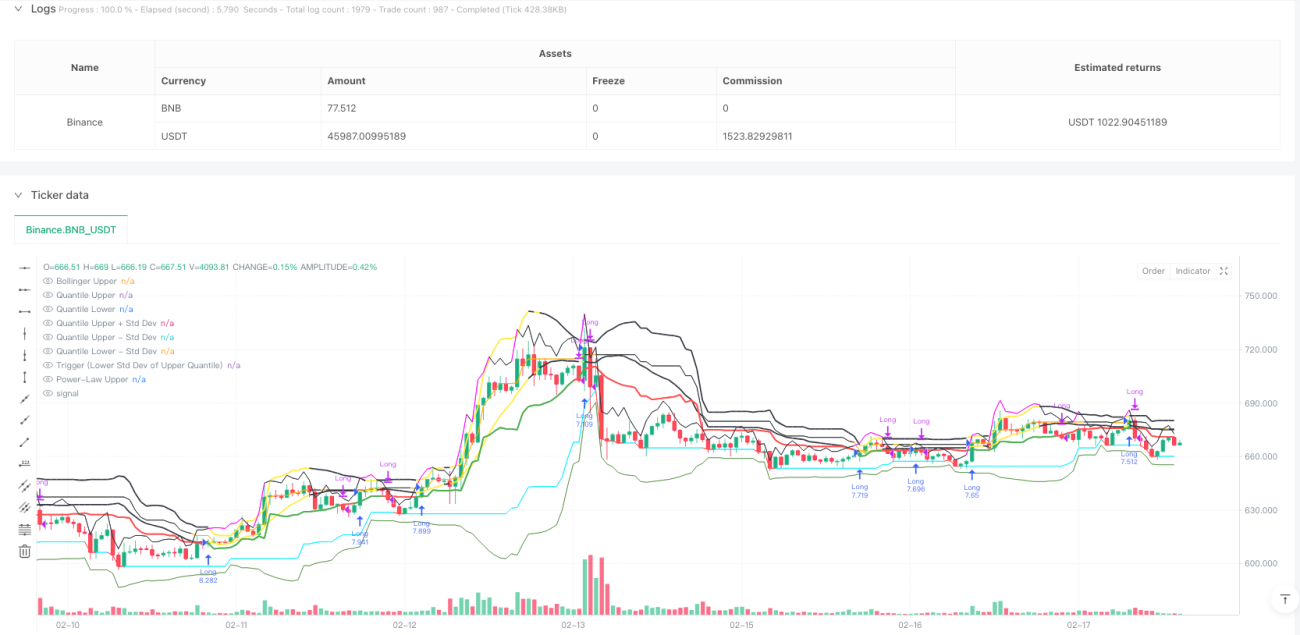
이 전략은 여러 통계 대역과 트렌드 분석을 기반으로 한 거래 전략이다. 이 전략은 브린 대역, 분기 대역, 그리고 律을 사용하여 중요한 지지/저항 지역을 식별하고, 상위 분기 대역의 하위 표준 차이를 트리거 신호로 사용하여 입출시와 출출시를 결정한다. 전략 설계는 시장의 변동성을 충분히 고려하여 여러 통계 방법을 중첩하여 신호의 신뢰성을 높인다.
전략의 핵심 원칙은 여러 통계 대역의 교차로 시장 추세를 포착하는 것입니다. 주로 다음과 같은 몇 가지 핵심 구성 요소를 포함합니다.
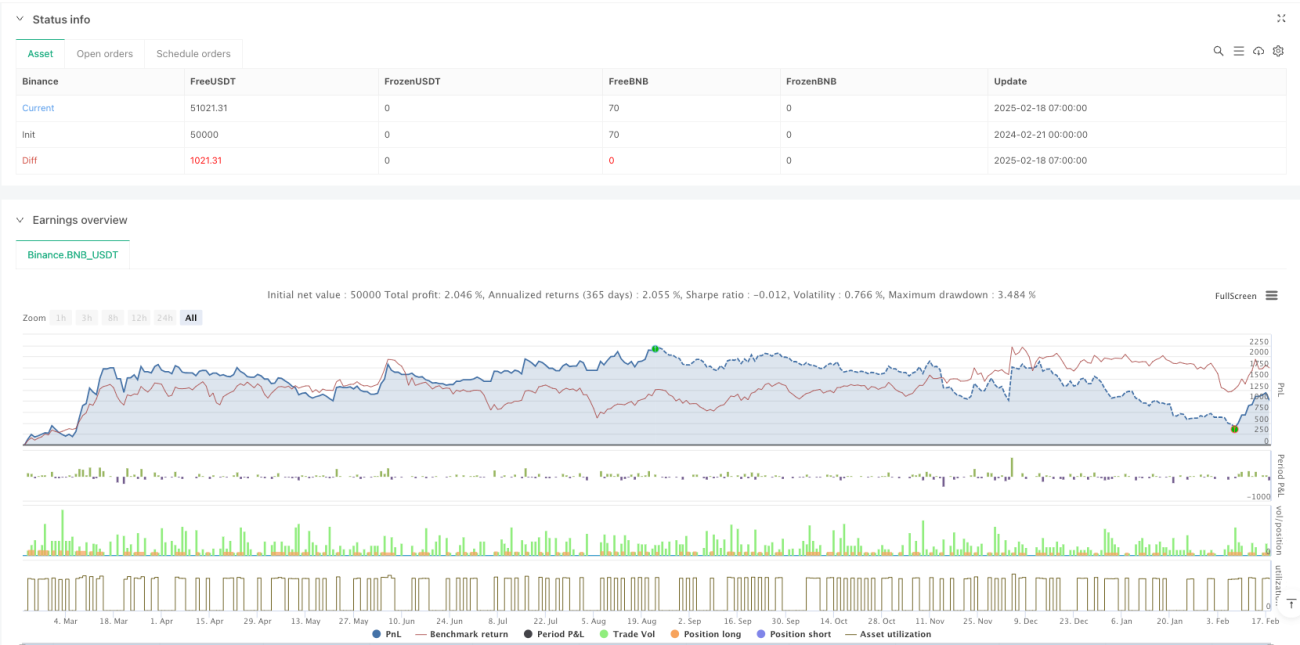
이것은 여러 가지 통계적 방법을 결합한 통합적 트렌드 추적 전략이다. 브린 밴드, 분수 밴드 및 律 밴드의 연동 작용을 통해 시장 추세를 더 잘 파악할 수 있으며, 동시에 좋은 위험 제어 능력을 갖추고 있다. 약간의 낙후성과 매개 변수 최적화 어려움이 있음에도 불구하고, 지속적인 개선과 최적화를 통해 이 전략은 더 나은 실용적 가치와 발전 전망을 가지고 있다.
/*backtest
start: 2024-02-21 00:00:00
end: 2025-02-18 08:00:00
period: 1h
basePeriod: 1h
exchanges: [{"eid":"Binance","currency":"BNB_USDT"}]
*/
//@version=6
strategy("Multi-Band Comparison Strategy with Separate Entry/Exit Confirmation", overlay=true,
default_qty_type=strategy.percent_of_equity, default_qty_value=10,
initial_capital=5000, currency=currency.USD)
// === Inputs ===
// Basic Parameters
length = input.int(20, "Length (SMA)", minval=1)
boll_mult = input.float(1.0, "Bollinger Band Multiplier", minval=0.1, step=0.1)
upper_quantile = input.float(0.95, "Upper Quantile (0.0-1.0)", minval=0.0, maxval=1.0)
lower_quantile = input.float(0.05, "Lower Quantile (0.0-1.0)", minval=0.0, maxval=1.0)
// Separate confirmation inputs
entry_confirmBars = input.int(1, "Entry Confirmation Bars", minval=1, tooltip="Number of consecutive bars the entry condition must hold")
exit_confirmBars = input.int(1, "Exit Confirmation Bars", minval=1, tooltip="Number of consecutive bars the exit condition must hold")
// Toggle Visibility for Bands
show_lower_boll = input.bool(false, "Show Lower Bollinger Band", tooltip="Enable or disable the lower Bollinger Band")
show_upper_boll = input.bool(true, "Show Upper Bollinger Band", tooltip="Enable or disable the upper Bollinger Band")
show_lower_quant = input.bool(true, "Show Lower Quantile Band", tooltip="Enable or disable the lower Quantile Band")
show_upper_quant = input.bool(true, "Show Upper Quantile Band", tooltip="Enable or disable the upper Quantile Band")
show_upper_power = input.bool(true, "Show Upper Power-Law Band", tooltip="Enable or disable the upper Power-Law Band")
show_lower_power = input.bool(false, "Show Lower Power-Law Band", tooltip="Enable or disable the lower Power-Law Band")
show_quant_std = input.bool(true, "Show Standard Deviation around Quantile Bands", tooltip="Enable or disable standard deviation lines around Quantile Bands")
// Individual Toggles for Std Dev Lines
show_upper_quant_std_up = input.bool(true, "Show Upper Quantile + Std Dev", tooltip="Enable or disable the Upper Quantile + Std Dev line")
show_upper_quant_std_down = input.bool(true, "Show Upper Quantile - Std Dev", tooltip="Enable or disable the Upper Quantile - Std Dev line")
show_lower_quant_std_up = input.bool(false, "Show Lower Quantile + Std Dev", tooltip="Enable or disable the Lower Quantile + Std Dev line")
show_lower_quant_std_down = input.bool(true, "Show Lower Quantile - Std Dev", tooltip="Enable or disable the Lower Quantile - Std Dev line")
// Moving Average Toggles
show_ema = input.bool(false, "Show EMA", tooltip="Enable or disable the Exponential Moving Average")
show_sma = input.bool(false, "Show SMA", tooltip="Enable or disable the Simple Moving Average")
// EMA Parameters
ema_length = input.int(50, minval=1, title="EMA Length")
ema_source = input.source(close, title="EMA Source")
// === Data Handling ===
// Create persistent arrays to store data
var float[] data_array = array.new_float()
var float[] return_array = array.new_float()
// Update the data array with the latest close prices
if array.size(data_array) < length
array.push(data_array, close)
else
array.shift(data_array)
array.push(data_array, close)
// Update the return array with the latest returns
returns = close / close[1] - 1
if array.size(return_array) < length
array.push(return_array, returns)
else
array.shift(return_array)
array.push(return_array, returns)
// === Helper Function ===
// Function to calculate a custom percentile
f_percentile(arr, quantile) =>
arr_sorted = array.copy(arr)
array.sort(arr_sorted, order.ascending)
index = math.round((array.size(arr_sorted) - 1) * quantile)
array.get(arr_sorted, index)
// === Calculations ===
// Bollinger Bands Calculation
sma = ta.sma(close, length)
stdev = ta.stdev(close, length)
boll_upper = sma + boll_mult * stdev
boll_lower = sma - boll_mult * stdev
// Power-Law Bands Calculation
var float power_upper = na
var float power_lower = na
if array.size(return_array) == length
power_upper := f_percentile(return_array, upper_quantile)
power_lower := f_percentile(return_array, lower_quantile)
var float power_upper_band = na
var float power_lower_band = na
if not na(power_upper) and not na(power_lower)
power_upper_band := close * (1 + power_upper)
power_lower_band := close * (1 + power_lower)
// Quantile Bands Calculation
var float quant_upper = na
var float quant_lower = na
if array.size(data_array) == length
quant_upper := f_percentile(data_array, upper_quantile)
quant_lower := f_percentile(data_array, lower_quantile)
// Standard Deviation around Quantile Bands
quant_upper_std_up = quant_upper + stdev
quant_upper_std_down = quant_upper - stdev
quant_lower_std_up = quant_lower + stdev
quant_lower_std_down = quant_lower - stdev
// === Color Calculations ===
// For the upper Bollinger band, color it yellow when price is above it, black otherwise.
upper_boll_color = close > boll_upper ? color.yellow : color.black
// The entry/exit trigger is based on the lower std dev band of the upper quantile band.
// It "turns green" (i.e. favorable for entry) when the price is above this level,
// and "turns red" (i.e. unfavorable, triggering an exit) when price is below it.
triggerCondition = close > quant_upper_std_down
// For plotting purposes, define the color of the lower std dev band of the upper quantile band:
triggerColor = triggerCondition ? color.green : color.red
// (Other color definitions remain for the additional bands.)
upper_power_color = (not na(power_upper_band) and not na(quant_upper_std_up) and power_upper_band > quant_upper_std_up) ? color.new(#FF00FF, 0) : color.black
upper_quant_color = (not na(quant_upper) and not na(power_upper_band) and power_upper_band > quant_upper) ? color.new(#FFAE00, 0) : color.rgb(50, 50, 50)
upper_quant_std_down_color = (not na(quant_upper_std_down) and close > quant_upper_std_down) ? color.green : color.red
lower_quant_std_down_color = (not na(quant_lower_std_down) and close > quant_lower_std_down) ? color.rgb(24, 113, 0, 44) : color.red
lower_quant_color = (ta.cross(close, quant_lower) or close == quant_lower) ? color.red : color.rgb(0, 238, 255)
// For demonstration, a variable to toggle a color on the Bollinger crossover.
var color upper_quant_std_up_color = color.black
if ta.crossover(close, boll_upper)
upper_quant_std_up_color := color.yellow
if ta.crossunder(close, boll_upper)
upper_quant_std_up_color := color.black
// === Confirmation Bars Logic with Separate Counters Based on Trigger Condition ===
// Use the trigger condition (based on the lower std dev band of the upper quantile band)
// for entry/exit confirmation.
var int entryCounter = 0
var int exitCounter = 0
// When triggerCondition is true (price above quant_upper_std_down) the "green" state holds.
entryCounter := triggerCondition ? entryCounter + 1 : 0
// When triggerCondition is false (price below quant_upper_std_down) the "red" state holds.
exitCounter := not triggerCondition ? exitCounter + 1 : 0
// === Strategy Orders ===
// Enter long when triggerCondition has been true for at least entry_confirmBars bars and no position is active.
if (entryCounter >= entry_confirmBars) and (strategy.position_size <= 0)
strategy.entry("Long", strategy.long)
// Exit long when triggerCondition has been false for at least exit_confirmBars bars and a long position is active.
if (exitCounter >= exit_confirmBars) and (strategy.position_size > 0)
strategy.close("Long")
// === Plotting ===
// Plot Bollinger Bands
plot(show_upper_boll ? boll_upper : na, color=upper_boll_color, title="Bollinger Upper", linewidth=2)
plot(show_lower_boll ? boll_lower : na, color=color.red, title="Bollinger Lower", linewidth=1)
// Plot Power-Law Bands
plot(show_upper_power ? power_upper_band : na, color=upper_power_color, title="Power-Law Upper", linewidth=1)
plot(show_lower_power ? power_lower_band : na, color=color.rgb(255, 59, 248), title="Power-Law Lower", linewidth=1)
// Plot Quantile Bands
plot(show_upper_quant ? quant_upper : na, color=upper_quant_color, title="Quantile Upper", linewidth=1)
plot(show_lower_quant ? quant_lower : na, color=lower_quant_color, title="Quantile Lower", linewidth=1)
// Plot Standard Deviation around Quantile Bands
plot(show_quant_std and show_upper_quant and show_upper_quant_std_up ? quant_upper_std_up : na, color=upper_quant_std_up_color, title="Quantile Upper + Std Dev", linewidth=2)
plot(show_quant_std and show_upper_quant and show_upper_quant_std_down ? quant_upper_std_down : na, color=upper_quant_std_down_color, title="Quantile Upper - Std Dev", linewidth=2)
plot(show_quant_std and show_lower_quant and show_lower_quant_std_up ? quant_lower_std_up : na, color=color.green, title="Quantile Lower + Std Dev", linewidth=1)
plot(show_quant_std and show_lower_quant and show_lower_quant_std_down ? quant_lower_std_down : na, color=lower_quant_std_down_color, title="Quantile Lower - Std Dev", linewidth=1)
// Also plot the trigger line (lower std dev band of upper quantile band) with its own color
plot(show_quant_std ? quant_upper_std_down : na, color=triggerColor, title="Trigger (Lower Std Dev of Upper Quantile)", linewidth=2)
// Plot SMA for reference
plot(show_sma ? sma : na, color=color.rgb(0, 24, 132), title="SMA", linewidth=3)
// Plot EMA for reference
ema_value = ta.ema(ema_source, ema_length)
plot(show_ema ? ema_value : na, color=color.rgb(147, 0, 0), title="EMA", linewidth=2)