다중 시간대를 기반으로 한 동적 트렌드 거래 전략 허스트 지수와 피보나치 수정

HURST FIBONACCI RSI MTF RR SL TP ATR
생성 날짜: 2025-02-20 16:59:37 마지막으로 수정됨: 2025-02-20 16:59:37
복사: 2 클릭수: 393
avatar of ianzeng123 ianzeng123
2
집중하다
319
수행원

다중 시간대를 기반으로 한 동적 트렌드 거래 전략 허스트 지수와 피보나치 수정 다중 시간대를 기반으로 한 동적 트렌드 거래 전략 허스트 지수와 피보나치 수정

개요

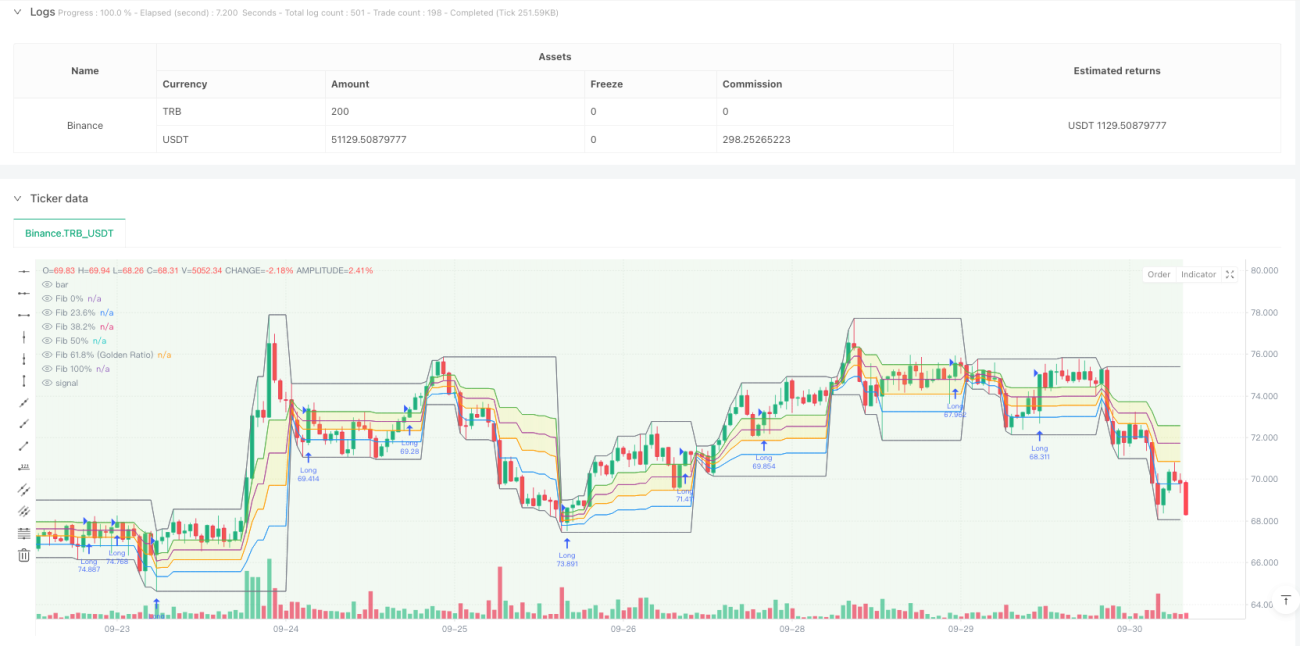
이것은 허스트 지수 (Hurst Exponent) 와 피보나치 회수 수준을 결합한 혁신적인 다중 시간 주기 거래 전략이다. 이 전략은 다른 시간 주기의 허스트 지수를 계산하여 시장의 추세 특성을 평가하고 피보나치 핵심 가격 수준과 결합하여 잠재적인 거래 기회를 식별한다. 이 전략은 고정된 위험 비율, 목표 수익률 및 매일 및 전체 거래 빈도 제한을 포함한 엄격한 위험 관리 프레임 워크를 사용합니다.

전략 원칙

전략의 핵심 논리는 두 가지 주요 구성 요소에 기반합니다.

  1. 현재 및 더 높은 시간 주기 허스트 지수를 계산하여 시장의 경향 성질을 평가한다. 허스트 지수는 0.5보다 크면 시장이 경향 지속성을 나타내고, 0.5보다 작으면 시장이 평균 회귀 특성이 있을 수 있음을 나타낸다.
  2. 매일의 하락을 계산하는 중요한 피보나치 회귀 수준을 활용하여 61.8% (금분할) 과 38.2%의 두 수준에 초점을 맞추십시오. 당일 라인 허스트 지수가 0.5 이상이고 가격이 61.8%의 수준을 넘어서면 다중 신호를 유발합니다. 당일 라인 허스트 지수가 0.5 미만이고 가격이 38.2%의 수준을 넘어서면 공백 신호를 유발합니다.

전략적 이점

  1. 다차원 분석: 다양한 시기의 추세 분석과 가격 수준을 결합하여 더 포괄적인 시장 관점을 제공합니다.
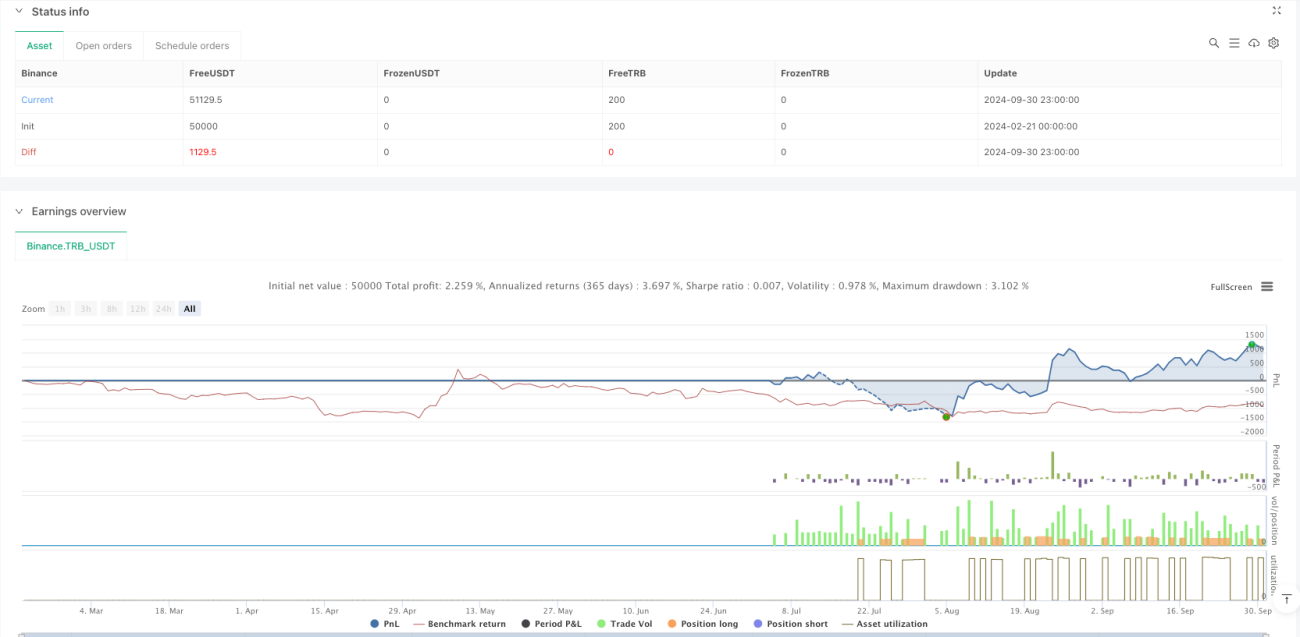
  2. 리스크 관리: 고정된 리스크 비율 ((2%) 과 목표 수익 손실 비율 ((1:2) 의 리스크 관리 프레임 워크
  3. 거래 주파수 제어: 하루 최대 거래 수와 총 거래 수 제한을 설정하여 과도한 거래를 방지하십시오.
  4. 시각적 보조: 실시간 시장 추세 배경 색상 변경 및 주요 지표 정보 표

전략적 위험

  1. 시장 환경 의존성: 추세가 보이지 않는 가로수지 시장에서 부진할 수 있다.
  2. 변수 민감성: 허스트 지수 계산 주기 및 피보나치 시간 주기 선택이 전략 성능에 영향을 미칩니다.
  3. 슬라이드 효과: 유동성이 낮은 시장 조건에서 더 큰 슬라이드 위험에 직면 할 수 있습니다.
  4. 시스템 복잡성: 여러 구성 요소의 조합으로 전략 실패의 가능성이 증가

전략 최적화 방향

  1. 동적 변수 조정: 시장의 변동에 따라 허스트 지수 계산 주기를 자동으로 조정할 수 있습니다.
  2. 필터 추가: 추가 시장 상태 필터를 도입하여 신호 품질을 향상시킵니다.
  3. 포지션 관리를 최적화: 변동율 기반의 동적 포지션 관리를 구현
  4. 경기 출전 제도를 개선: 더 유연한 수익 목표 설정 방법을 개발

요약하다

이것은 기술 분석의 고전적인 도구와 현대적인 양적 방법을 결합하는 혁신적인 전략이다. 다중 시간 주기의 분석과 엄격한 위험 관리를 통해, 전략은 이론적 기반을 유지하면서도 실전적 가능성에 초점을 맞추고 있다. 약간의 최적화 공간이 있지만, 전체적인 프레임워크는 좋은 확장성과 실용적 가치를 가지고 있다.

전략 소스 코드
/*backtest
start: 2024-02-21 00:00:00
end: 2024-10-01 00:00:00
period: 1h
basePeriod: 1h
exchanges: [{"eid":"Binance","currency":"TRB_USDT"}]
*/

//@version=5
// Advanced Multi-Timeframe Trading System (Risk Managed)
// 
// Description:
// This strategy combines an approximate measure of market trending via a Hurst exponent
// calculation with Fibonacci retracement levels derived from a higher timeframe (default: Daily)
// to identify potential reversal zones and trade opportunities. The Hurst exponent is calculated
// as a rough indicator of market persistence, while the Fibonacci retracement levels provide potential
// support and resistance areas.
// 
// Signal Logic:
// - A long entry is signaled when the price crosses above the 61.8% Fibonacci level (Golden Ratio)
//   and the daily Hurst exponent is above 0.5 (suggesting a trending market).
// - A short entry is signaled when the price crosses below the 38.2% Fibonacci level and the daily Hurst
//   exponent is below 0.5.
// 
// Risk Management:
// Each trade is risk-managed with a stop-loss set at 2% below (or above for shorts) the entry price,
// and a take profit order is set to achieve a 1:2 risk-reward ratio. Position sizing is fixed at 10% of
// equity per trade. Additionally, the strategy limits trading to a maximum of 5 trades per day and 510 trades
// overall (for backtesting since 2019) to ensure a realistic number of orders.
// 
// Backtesting Parameters:
// - Initial Capital: $10,000
// - Commission: 0.1% per trade
// - Slippage: 1 tick per bar
// - Position Sizing: 10% of equity per trade
// 
// Disclaimer:
// Past performance is not indicative of future results. This strategy is experimental and is provided solely
// for educational purposes. Use caution and perform your own testing before any live deployment.
// 
// Author: [Your Name]
// Date: [Date]

strategy("Advanced Multi-Timeframe Trading System (Risk Managed)",
     overlay=true, 
     max_bars_back=500, 
     initial_capital=10000, 
     default_qty_type=strategy.percent_of_equity, 
     default_qty_value=10,          // 10% of equity per trade
     commission_type=strategy.commission.percent, 
     commission_value=0.1,          // 0.1% commission per trade
     slippage=1,                    // 1 tick per bar
     calc_on_order_fills=true, 
     calc_on_every_tick=true)

// ─── INPUTS ─────────────────────────────────────────────────────────────
hurstLen        = input.int(50, title="Hurst Lookback Period", minval=10)
fibTF           = input.timeframe("D", title="Fibonacci Retracement Timeframe")
maxTradesPerDay = input.int(5, title="Max Trades Per Day", minval=1)
maxTotalTrades  = input.int(510, title="Max Total Trades since 2019", minval=1)
riskPerc        = input.float(2.0, title="Risk Percent per Trade (%)", step=0.1) * 0.01  // 2% risk per trade
rrRatio         = input.float(2.0, title="Risk-Reward Ratio", step=0.1)                 // Target profit = 2x risk

// ─── FUNCTION: Approximate Hurst Exponent Calculation ──────────────────────
// This function uses a simple rescaled range method to approximate the Hurst exponent.
// Note: This is an experimental calculation and should be interpreted as a rough gauge of market trending.
calcHurst(src, len) =>
    mean   = ta.sma(src, len)
    dev    = src - mean
    cumDev = 0.0
    for i = 0 to len - 1
        cumDev := cumDev + dev[i]
    R     = ta.highest(cumDev, len) - ta.lowest(cumDev, len)
    S     = ta.stdev(src, len)
    hurst = na(S) or S == 0 ? na : math.log(R / S) / math.log(len)
    hurst

// Calculate the Hurst exponent on the current timeframe and from a higher timeframe (daily)
currHurst  = calcHurst(close, hurstLen)
dailyHurst = request.security(syminfo.tickerid, "D", calcHurst(close, hurstLen))

// ─── FIBONACCI RETRACEMENT LEVELS (WITH GOLDEN RATIO) ──────────────────────────
// Retrieve the daily high/low from the selected timeframe (default: Daily)
dHigh   = request.security(syminfo.tickerid, fibTF, high)
dLow    = request.security(syminfo.tickerid, fibTF, low)

// Define Fibonacci levels between the daily low and high.
fib_0   = dLow
fib_100 = dHigh
fib_236 = dLow + 0.236 * (dHigh - dLow)
fib_382 = dLow + 0.382 * (dHigh - dLow)
fib_500 = dLow + 0.5   * (dHigh - dLow)
fib_618 = dLow + 0.618 * (dHigh - dLow)  // Golden ratio level

// Plot the Fibonacci levels for reference.
pFib0   = plot(fib_0,   color=color.gray,   title="Fib 0%")
pFib236 = plot(fib_236, color=color.blue,   title="Fib 23.6%")
pFib382 = plot(fib_382, color=color.orange, title="Fib 38.2%")
pFib500 = plot(fib_500, color=color.purple, title="Fib 50%")
pFib618 = plot(fib_618, color=color.green,  title="Fib 61.8% (Golden Ratio)")
pFib100 = plot(fib_100, color=color.gray,   title="Fib 100%")
// Fill the area between the 61.8% and 38.2% levels to highlight the key retracement zone.
fill(pFib618, pFib382, color=color.new(color.yellow, 80), title="Fibonacci Retracement Zone")

// ─── TRADE COUNT MANAGEMENT ─────────────────────────────────────────────────
// To simulate realistic trading frequency, the strategy limits trades to a maximum of 5 per day and 510 overall.
var int tradesToday     = 0
var int globalTradeCount = 0

// Reset the daily trade counter at the start of a new day.
newDay = ta.change(time("D"))
if newDay
    tradesToday := 0

// Allow new trades only if within the daily and overall trade limits.
canTrade = (tradesToday < maxTradesPerDay) and (globalTradeCount < maxTotalTrades)

// ─── TRADING SIGNALS ─────────────────────────────────────────────────────────
// Entry conditions based on Fibonacci levels and daily Hurst conditions:
// • Long: Price crosses above the 61.8% (Golden Ratio) level and daily Hurst > 0.5.
// • Short: Price crosses below the 38.2% level and daily Hurst < 0.5.
longCond  = ta.crossover(close, fib_618) and (dailyHurst > 0.5)
shortCond = ta.crossunder(close, fib_382) and (dailyHurst < 0.5)

if longCond and canTrade
    strategy.entry("Long", strategy.long)
    tradesToday      := tradesToday + 1
    globalTradeCount := globalTradeCount + 1

if shortCond and canTrade
    strategy.entry("Short", strategy.short)
    tradesToday      := tradesToday + 1
    globalTradeCount := globalTradeCount + 1

// ─── RISK MANAGEMENT: STOP-LOSS & TAKE-PROFIT ──────────────────────────────
// For active positions, define stop-loss and take profit levels based on the entry price.
// This ensures that each trade risks approximately 2% of the entry price with a target
// of 2x the risk (1:2 risk-reward ratio).
if strategy.position_size > 0
    longStop   = strategy.position_avg_price * (1 - riskPerc)
    longTarget = strategy.position_avg_price * (1 + rrRatio * riskPerc)
    strategy.exit("Long Exit", from_entry="Long", stop=longStop, limit=longTarget)
if strategy.position_size < 0
    shortStop   = strategy.position_avg_price * (1 + riskPerc)
    shortTarget = strategy.position_avg_price * (1 - rrRatio * riskPerc)
    strategy.exit("Short Exit", from_entry="Short", stop=shortStop, limit=shortTarget)

// ─── CHART OVERLAYS & VISUAL AIDS ────────────────────────────────────────────
// Background color indicates the daily market trend:
// Green for trending conditions (dailyHurst > 0.5) and red for less trending conditions.
bgcolor(dailyHurst > 0.5 ? color.new(color.green, 90) : color.new(color.red, 90), title="Daily Trend Background")

// Display an information table in the top-right corner to help interpret key values.
var table infoTable = table.new(position.top_right, 2, 4, border_width=1, frame_color=color.gray)
if barstate.islast
    table.cell(infoTable, 0, 0, "Current Hurst", text_color=color.white, bgcolor=color.black)
    table.cell(infoTable, 1, 0, str.tostring(currHurst, "#.###"), text_color=color.white, bgcolor=color.black)
    table.cell(infoTable, 0, 1, "Daily Hurst", text_color=color.white, bgcolor=color.black)
    table.cell(infoTable, 1, 1, str.tostring(dailyHurst, "#.###"), text_color=color.white, bgcolor=color.black)
    table.cell(infoTable, 0, 2, "Trades Today", text_color=color.white, bgcolor=color.black)
    table.cell(infoTable, 1, 2, str.tostring(tradesToday), text_color=color.white, bgcolor=color.black)
    table.cell(infoTable, 0, 3, "Global Trades", text_color=color.white, bgcolor=color.black)
    table.cell(infoTable, 1, 3, str.tostring(globalTradeCount), text_color=color.white, bgcolor=color.black)

// Optional: Add labels on the final bar to mark the key Fibonacci levels.
if barstate.islast
    label.new(bar_index, fib_618, "61.8% (Golden Ratio)", style=label.style_label_left, color=color.green, textcolor=color.white, size=size.tiny)
    label.new(bar_index, fib_382, "38.2%", style=label.style_label_left, color=color.orange, textcolor=color.white, size=size.tiny)